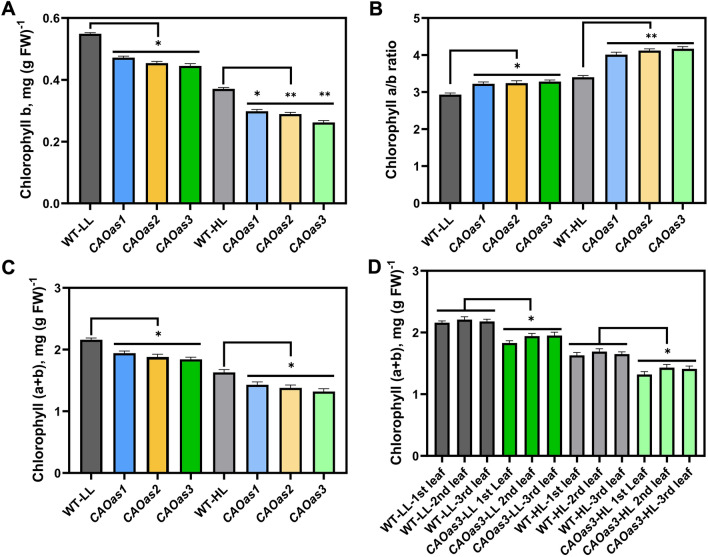
Fig. 2.
Chlorophyll content of wild-type (WT) and CAO antisense (CAOas) tobacco plants grown under low-light (LL) and high-light (HL) in the greenhouse A chlorophyll b, B chlorophyll a/b ratio, C Total chlorophyll content, and, D Total chlorophyll content of the 2nd, 3rd and 4th leaf from the top, from WT and CAOas plants. Plants were grown for up to 30 days under light intensity of 300 μmol photons m−2 s−1; then, they were transferred to LL (70–80 μmol photons m−2 s−1) and HL (700–800 μmol photons m−2 s−1) for additional 4 weeks. Each data point is the average of seven replicates and error bars represent the ± SE; asterisks indicate significant differences determined by ANOVA-test along with Dunnett’s post hoc test compared to WT (*P < 0.05, **P < 0.01). FW: Fresh weight. Statistical tests were conducted between WT and mutant within the same treatment. Lines have been drawn between WT and transgenic lines to show statistical differences between them

