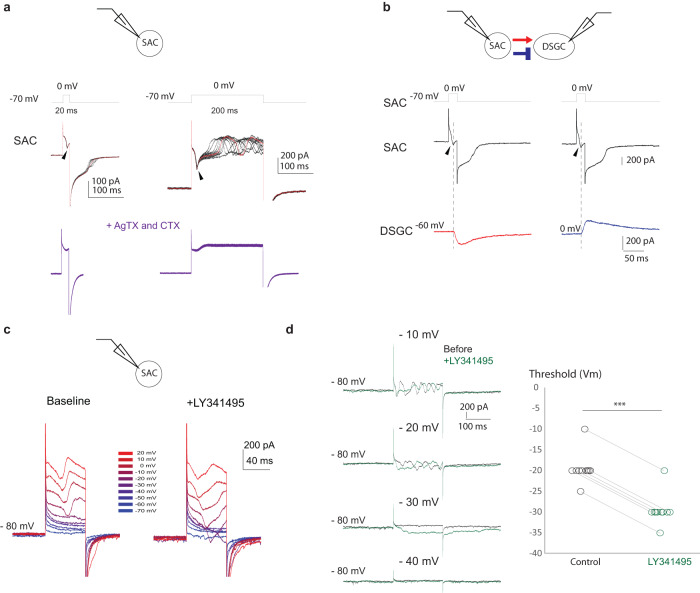
Fig. 6. mGluR2 signaling increases the threshold of voltage-gated calcium channels in SACs.
a Voltage clamp recordings of SACs. Currents evoked by short (left) and long (right) depolarizing steps were recorded before and after the application of N and P/Q type calcium channel antagonists ω-conotoxin (CTX) and ω-Agatoxin IVA (AgTX). Arrowheads indicate peaks of fast calcium currents. Regenerative calcium spikes are present during long depolarization (upper right traces) and fully blocked by Ca channel antagonists. Modified from Koren. et al., 2015, Fig. S4. b Example traces of paired SAC-DSGC voltage clamp recording from a null side SAC-DSGC pair. Dashed vertical lines indicate the relative time between the presynaptic SAC calcium currents and the postsynaptic DSGC EPSC (left) and IPSC (right). c Currents of a SAC in response to deploarizing voltage steps before and after application of LY341395. d Left: Currents of a SAC in response to different levels of 200 ms voltage steps before and after LY341495. Right: Vm threshold of calcium currents before and after LY341495. Lines connect the same cells before and after LY application. Two-sided paired student t test, p = 0.0002, n = 10 cells. Source data are provided as a Source Data file.

