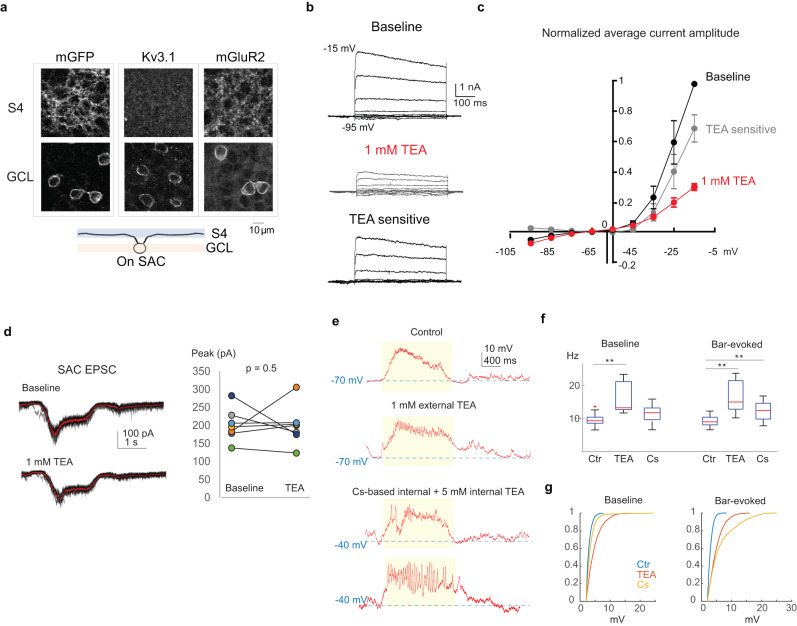
Fig. 7. Kv3 channel prevents fast voltage fluctuations at SAC soma.
a Fluorescence signals from SACs expressing a membrane-bound GFP (mGFP, left), or immunostained for Kv3.1 (middle) and mGluR2 (right) at the dendritic layer (S4, upper panels) and cell body layer (GCL, lower pannels). This experiment was repeated three times with similar results. b SAC currents at different voltage steps before and after applying 1 mM extracellular TEA (upper and middle), and isolated TEA-sensitive currents after subtraction between the two (lower). c I–V relationship of potassium current components, n = 6 cells. Data are presented as mean values ± SEM. d SAC EPSCs to flashing spot stimulus in control condition and in 1 mM TEA (black: individual trials; red: mean). Baseline: 304 + /− 47 pA; after TEA: 323 + /− 39 pA; p = 0.22, two-sided paired t test, n = 8 cells. e SAC somatic Vm during the moving bar stimulus under different conditions that block potassium channels. Yellow shaded area represents the period during which the bar is present in the receptive field. f Summary plot of the frequency of fast voltage events before (Baseline) and during moving bar stimulation (Bar-evoked) under conditions in (e). Control: n = 13 cells; TEA: 1 mM external TEA, n = 8 cells; Cs: Cs-based internal solution with 5 mM intracellular TEA, n = 11 cells. For each box, the central mark indicates the median, and the bottom and top edges of the box indicate the 25th and 75th percentiles, respectively. The whiskers extend to the most extreme data points not considered outliers, and the outliers are plotted individually using the ‘+‘ symbol. Kolmogorov-Smirnov Test, **p < 0.01. Bonferroni correction was made for multiple comparisons. g Cummulative distribution of peak amplitude of fast Vm events under conditions in (e). Source data are provided as a Source Data file.

