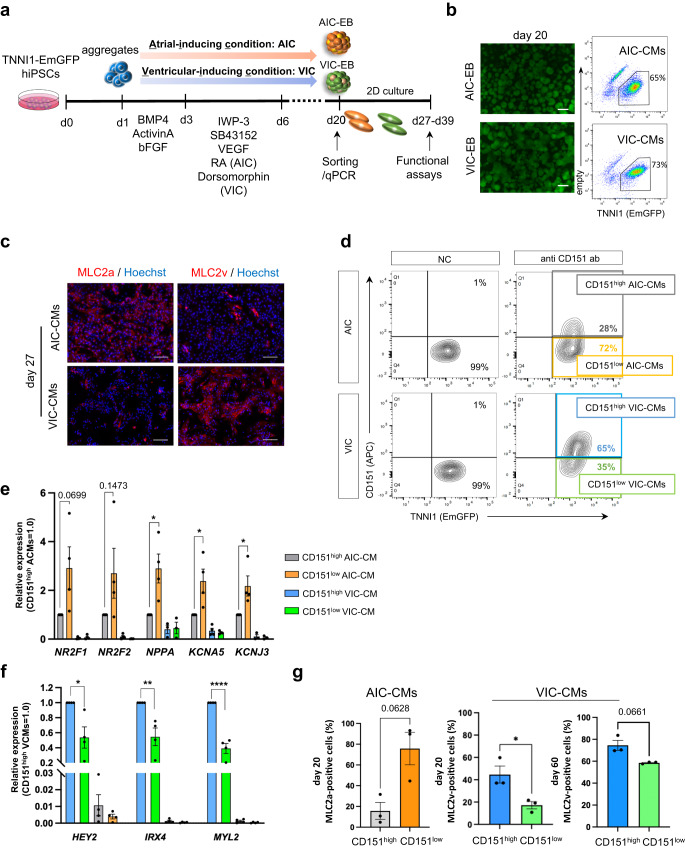
Fig. 1. Cell surface marker screening for hiPSC-ACMs and -VCMs.
a Schematic diagram and experimental schedule of cardiac differentiation protocol for AIC and VIC. b Representative fluorescence and flow cytometry images of day 20 AIC- and VIC-CMs. Scale bars = 100 μm. (See also Fig. S1a). c Representative immunofluorescence images showing MLC2a, MLC2v, and Hoechst staining on day-27 AIC- and VIC-CMs. Scale bars = 100 μm. (See also Fig. S1b). d Representative flow cytometry images of day 20 AIC- and VIC-CMs stained with CD151 antibody. The cut-off between CD151high and CD151low cells was determined using unstained CMs as a negative control. The gate containing most negative control CMs (>99%) was set as the CD151low gate (See also Figs. S2a and S2d). e Relative expression of atrial-related genes in CD151high/low AIC- and VIC-CMs, compared to CD151high AIC-CMs. n = 4 independent differentiation experiments per group. Data are expressed as mean ± SEM. Statistical analysis was conducted between CD151high AIC-CM and CD151low AIC-CM using an unpaired two-tailed t test. *p < 0.05. (See also Figs. S2b and S2e). f Relative expression of ventricular-related genes in CD151high/low VIC- and AIC-CMs compared to that of CD151high VCMs. n = 4 independent differentiation experiments per group. Data are expressed as mean ± SEM. Statistical analysis was conducted between CD151high VIC-CM and CD151low VIC-CM using an unpaired two-tailed t test. *p < 0.05, **p < 0.01, and ****p < 0.0001 (See also Figs.S2c and S2f). g MLC2a-positive cells fraction (%) in CD151high/low AIC-CMs on day 20 (left). MLC2v-positive cells fraction (%) in CD151high/low VIC-CMs on day 20 and day 60 (right). n = 3 independent differentiation experiments per group. Data are expressed as mean ± SEM. Statistical analysis was conducted using an unpaired two-tailed t test. *p < 0.05.

