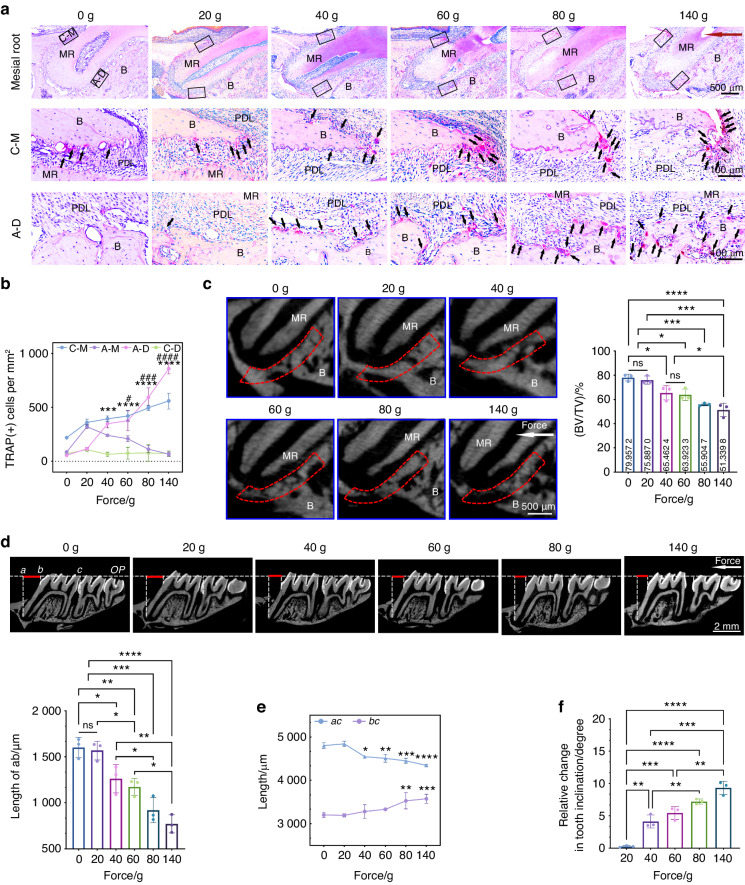
Fig. 2.
The osteoclastic activity in the A-D region of MR on the alveolar bone surface affects orthodontic tooth tipping. a TRAP staining images show the distribution of osteoclasts (black arrows) on the surface of alveolar bone varies along with force magnitudes and the most obvious change is reflected in the A-D region. The red arrow represents the orthodontic force orientation. C-M cervical mesial region, A-D apical distal region, MR mesial root, B alveolar bone, PDL periodontal ligament. b Statistics of TRAP-positive cells on the alveolar bone surface in regions of C-M, A-M, A-D and C-D. A-M apical mesial region, C-D cervical distal region. Mean ± SEM, n = 3. * Represents the statistics in the A-D region and # represents the C-M region. All the statistics come from the comparison with the group of 0 g. ***P < 0.001, ****P < 0.000 1, #P < 0.05, ###P < 0.001, ####P < 0.000 1 by two-way ANOVA. c Micro–computed tomography images show the level of alveolar bone resorption in the A-D region. Statistics of bone morphology-related parameter BV/TV is shown. BV bone volume, TV total volume, mean ± SD, n = 3. ns, not significant, *P < 0.05, ***P < 0.001, ****P < 0.000 1 by one-way ANOVA. d Taking the mesial cementoenamel junction of the second molar as a reference, ac represents the displacement of the mesial root apex, and bc represents the displacement of the crown. The relative displacements between the crown and the apex (the red lines represent ab) are shown in micro-CT images. OP occlusal plane. The statistics show the length of ab among groups, mean ± SD, n = 3. ns, not significant, *P < 0.05, **P < 0.01, ***P < 0.001, ****P < 0.000 1 by one-way ANOVA. e Statistics of length of ac and bc indicate the reverse displacement of the root apex increases from 40 g. All the statistics come from the comparison with the group of 0 g. Mean ± SD, n = 3. *P < 0.05, **P < 0.01, ***P < 0.001, ****P < 0.000 1 by two-way ANOVA. f Statistics of relative tooth inclination after 2-week force loading, mean ± SD, n = 3. **P < 0.01, ***P < 0.001, ****P < 0.000 1 by one-way ANOVA

