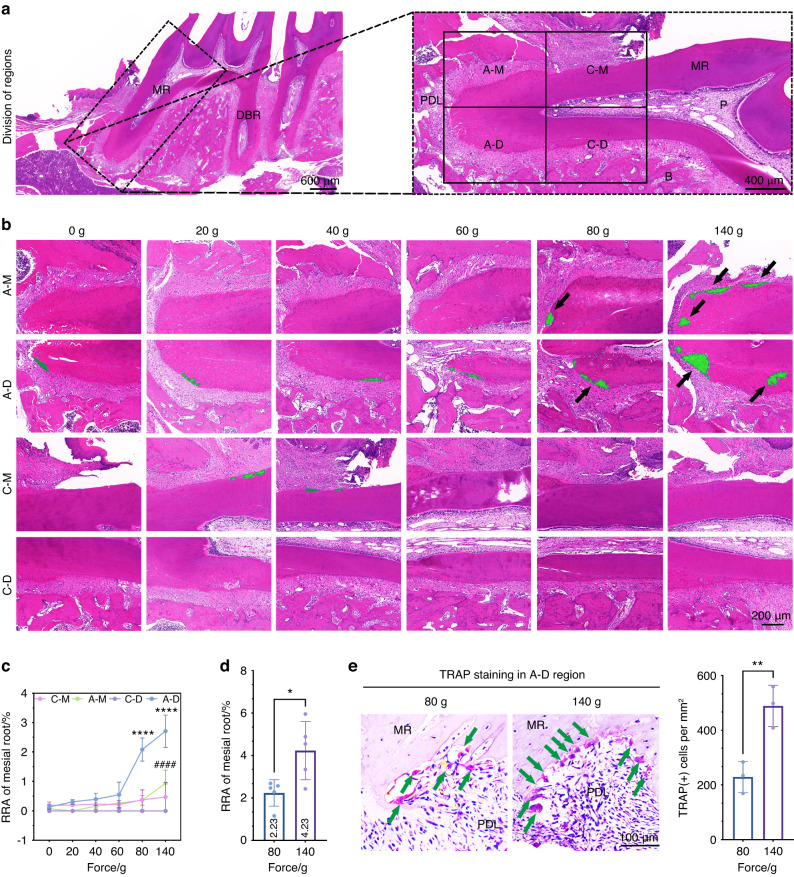
Fig. 3.
The changes on the root surface of A-D region are most sensitive to force magnitudes. a Schematic diagram of region division is shown. PDL periodontal ligament, DBR distal buccal root, MR mesial root, P pulp, B alveolar bone. A-M apical mesial region, C-M cervical mesial region, A-D apical distal region, C-D cervical distal region. b HE staining images of four regions in which the area of root resorption covered by green (black arrows) is mainly distributed in the A-D region after 2-week force loading. c Statistics of root resorption area of A-M, C-M, A-D, and C-D regions in MR. RRA root resorption area. * Represents the statistics of RRA in the A-D region, # represents the statistics of RRA in the A-M region and comes from the comparison with the group of 0 g. All the statistics come from the comparison with the group of 0 g, mean ± SD, n = 4–5. ****P < 0.000 1, ####P < 0.000 1 by two-way ANOVA. d Statistics of RRA of the entire mesial root, mean ± SD, n = 5. *P < 0.05 by Student’s t-test. e TRAP staining images of both 80 g group and 140 g group show the osteoclasts on the root surface (green arrows) in the A-D region. The data of the A-D region is calculated, mean ± SD. n = 3. **P < 0.01 by Student’s t-test

