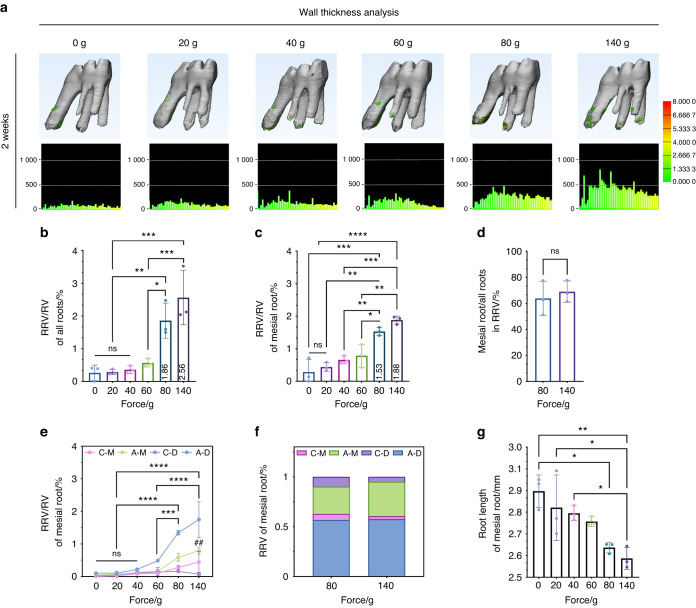
Fig. 4.
The vast majority of root resorption induced by excessive orthodontic force occurs in the A-D region. a The wall thickness analysis of root resorption of the first molar after 2-week force loading. b Statistics of root resorption volume percentages of all roots after two-week force loading. RRV root resorption volume, RV root volume, mean ± SD, n = 3. ns, not significant, *P < 0.05, **P < 0.01, ***P < 0.001 by one-way ANOVA. c Statistics of root resorption volume percentages of mesial roots, mean ± SD, n = 3. ns, not significant, *P < 0.05, **P < 0.01, ***P < 0.001, ****P < 0.000 1 by one-way ANOVA. d The root resorption volume proportion of the mesial root comparing to all roots, mean ± SD, n = 3. ns, not significant by Student’s t-test. e Statistics of root resorption volume of mesial roots in different regions. * represents the statistics in the A-D region. # Represents the statistics in the A-M region and comes from the comparison with the group of 0 g, mean ± SEM, n = 3. ns, not significant, ***P < 0.001, ****P < 0.000 1, ## P < 0.01 by two-way ANOVA. f The root resorption volume percentages of four regions in the mesial root under 80 and 140 g. The root resorption proportions in the A-D region are higher than others. n = 3. g Statistics of root length of mesial roots, mean ± SD, n = 3. *P < 0.05, **P < 0.01 by one-way ANOVA

