Fig. 5.
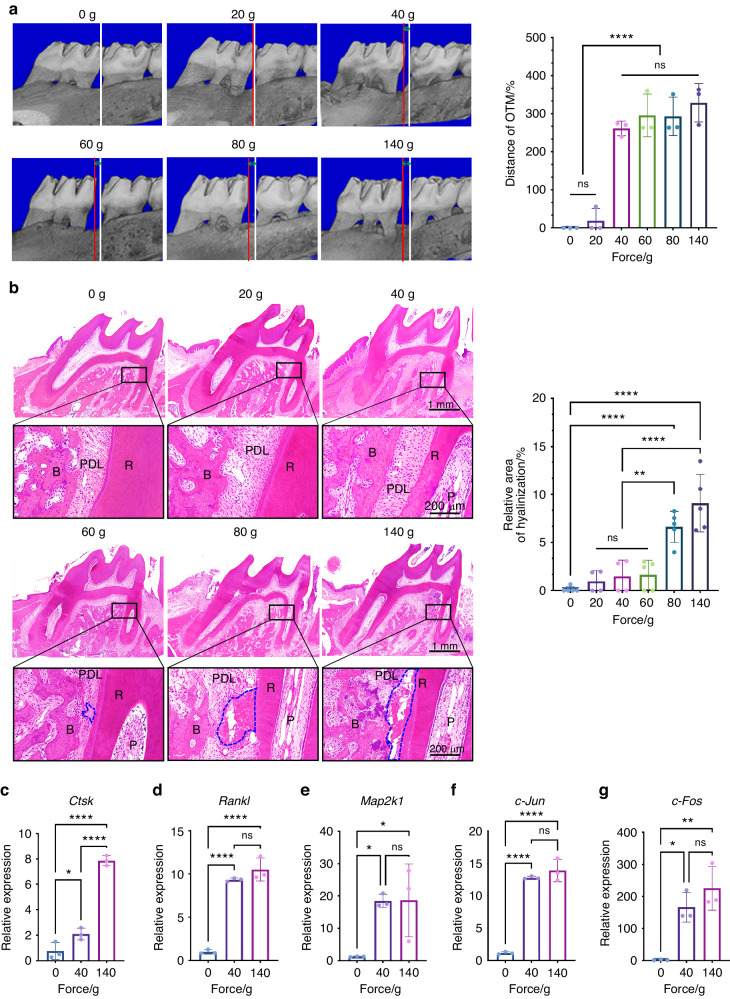
The optimal orthodontic force is 40 g in a rat model. a Micro-computed tomography images after 2-week force loading. The distance between the white line and the red line represents the distance of orthodontic tooth movement. The statistical results show no difference among the groups of 40 g and above. OTM orthodontic tooth movement. Mean ± SD, n = 3. ns, not significant, ****P < 0.000 1 by one-way ANOVA. b The area covered by a blue dot line represents hyalinization. R root, B bone, P dental pulp, PDL periodontal ligament. Mean ± SD, n = 4–5. ns, not significant, **P < 0.01, ****P < 0.000 1 by one-way ANOVA. c–g Gene relative expression results of Ctsk, Rankl, Map2k1, c-Jun and c-Fos in the alveolar bone around the mesial roots indicate that the mRNA expression levels by mechanical force are upregulated. Mean ± SD, n = 3. ns, not significant, *P < 0.05, **P < 0.01, ****P < 0.000 1 by one-way ANOVA

