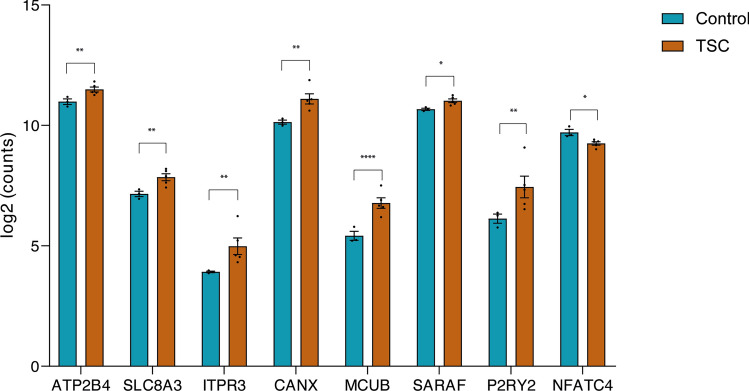
Fig. 2.
Differential expression of calcium related genes using single-cell RNA sequencing. Control and TSC tissues were sequenced using the 10 × genomics Chromium Single Cell Gene Expression Flex protocol. From all cells, astrocytes were extracted computationally, and differential expression analysis was performed using DESeq2 between control (n = 3) and TSC (n = 5) samples. Data are expressed as mean ± SEM. Adjusted p value: *p.adj ≤ 0.05; **p.adj ≤ 0.01; ****p.adj ≤ 0.0001)

