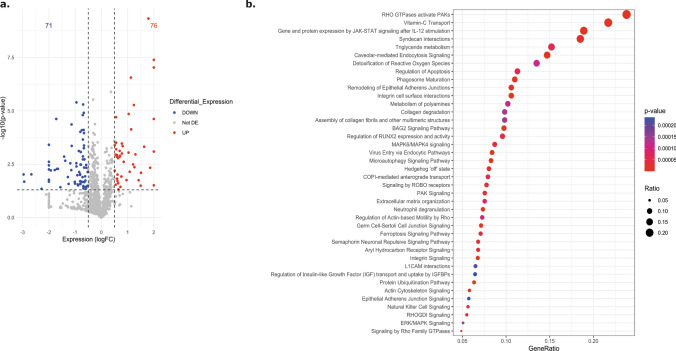
Fig. 3.
Ingenuity pathway analysis (IPA) on control and TSC primary astrocytes cultures. a. Volcano plot showing the differentially expressed proteins (DEPs) (p value ≤ 0.05) between control (n = 6) and TSC (n = 6) primary culture astrocytes. A total of 76 proteins were found to be upregulated and 71 downregulated in TSC compared to control astrocytes. b. Top-ranked 40 enriched canonical pathways predicted by IPA (p value ≤ 0.05). The size of each point is proportional to the number of differentially expressed proteins present in the pathway, while the intensity of the color indicates the p value of the predicted canonical signaling pathways

