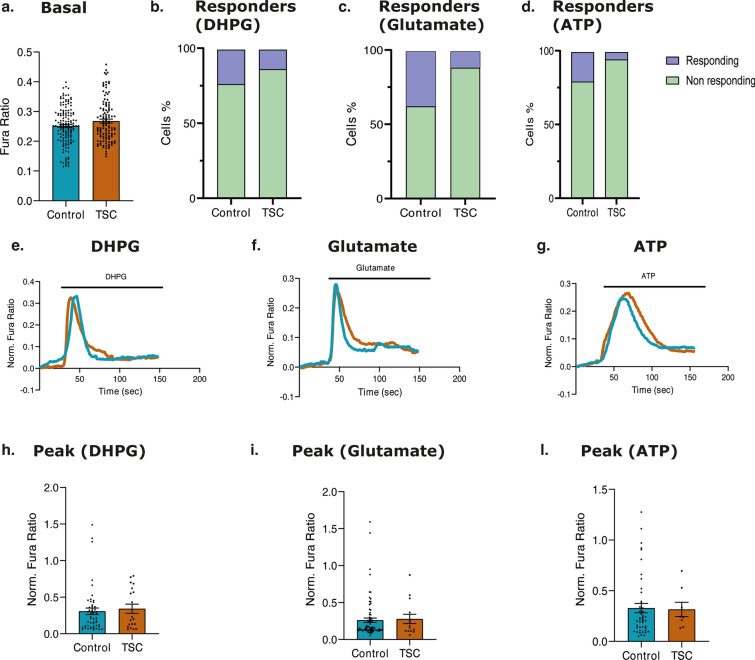
Fig. 4.
Ca2+ imaging in the cytoplasm of control and TSC astrocytes. Control and TSC astrocytes, previously loaded with Fura-2/AM, were stimulated with 200 μM DHPG, 200 μM Glutamate or 200 μM ATP in Ca2+-containing KRB solution (n = 216 control cells and n = 140 TSC cells, form 12 independent coverslip). a. No difference in basal Ca2+ level could be observed. b. c. d. The percentage of responding astrocytes (peak upon stimulation > 0.05), has been investigated, in both experimental group (light green: not responding cells; blue: responding cells). e. f. g. Representative curves of cytosolic Ca2+ responses upon the applied stimulus. The blue curve showed the Ca2+ response of control astrocytes, while the dark orange curve showed the Ca2+ response of TSC astrocytes. h. i. l. The amplitude of cytosolic Ca2+ response, upon DHPG, Glutamate and ATP stimulation has been measured, considering only responding cells in both control and TSC astrocytes. Data are expressed as mean ± SEM; p value: *p value ≤ 0.05; **p value ≤ 0.01; ***p value ≤ 0.001; ****p value ≤ 0.0001. Mann–Whitney U test

