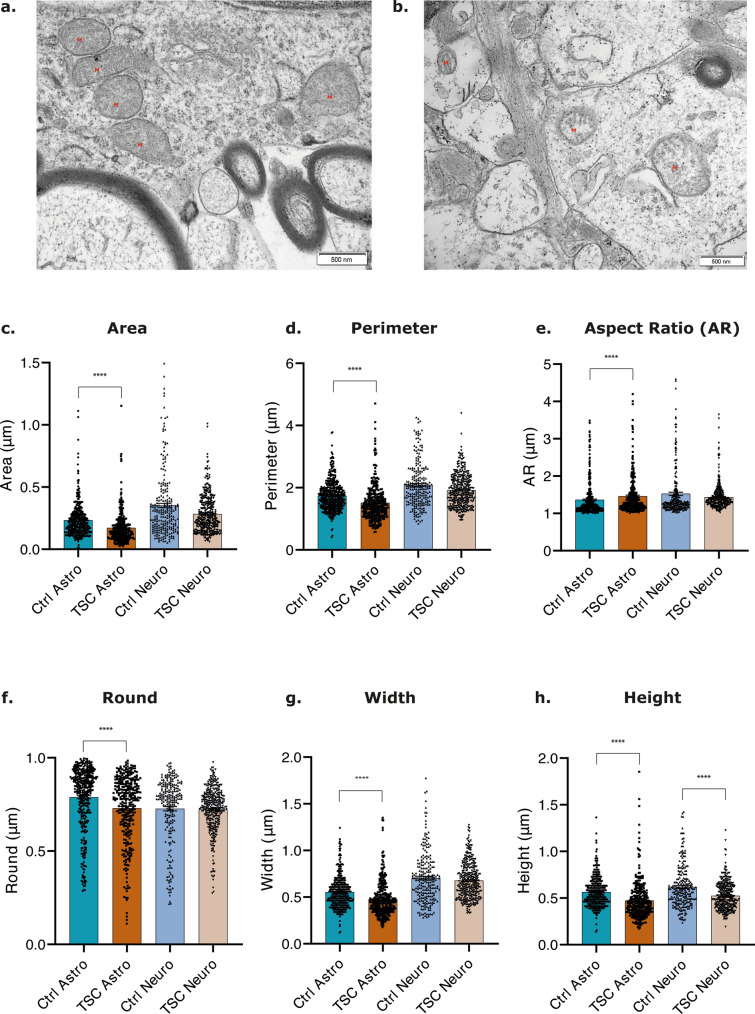
Fig. 9.
Electron microscopy analysis of mitochondria morphology in healthy-appearing astrocytes and neurons in TLE control tissue, astrocytes and dysmorphic neurons in TSC tissue. a, b. Electron microscopy of healthy-appearing astrocytes in TLE control tissue (a) and TSC tissue (b). Mitochondria were indicated by a red M. (scale bar: 500 nm). c-h. Multiple parameters were considered in the analysis to describe mitochondria morphology: area, perimeter, Aspect Ratio (AR), round, width, and height. TSC astrocytes showed significant reduction in area, perimeter, round, width and height compared to control astrocytes. e. A significant increase in the aspect ratio (AR) of mitochondria was identified in TSC astrocytes compared to control astrocytes. h. TSC neurons showed significant reduction in height compared to healthy-appearing TLE neurons. Data are expressed as mean ± SEM; Non-parametric Kruskal–Wallis H test was performed with correction for multiple comparisons. Significance is represented by p value: *p-value ≤ 0.05; **p value ≤ 0.01; ***p value ≤ 0.001; ****p value ≤ 0.0001

