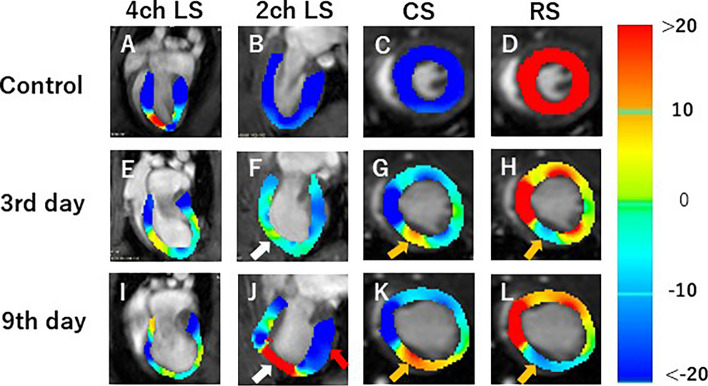
Fig. 9.
Strain-encoded functional magnetic resonance imaging of the end-systolic left ventricle. 4ch LS, 4ch view longitudinal strain; 2ch LS, 2ch view longitudinal strain; CS, short-axis view circumferential strain; RS, short-axis view radial strain. A, E, I LS in the long-axis 4ch view. B, F, J LS in the long-axis 2ch view. C, G, K CS in the short-axis view. D, H, L RS in the short-axis view. A, B, C, E Control, E, F, G, H 3 days after the onset of myocardial infarction, and I, J, K, L 9 days after the onset of myocardial infarction. The color bar shows the scale of the strain based on the end-diastolic left ventricle, with maximum contraction shown in red and minimum contraction in blue. White arrows: infarcted area. Red arrow: contracting area. Yellow arrows: reduced functionality (cited from Tomography 2023, 9(2), 871–882, Fig. 6)

