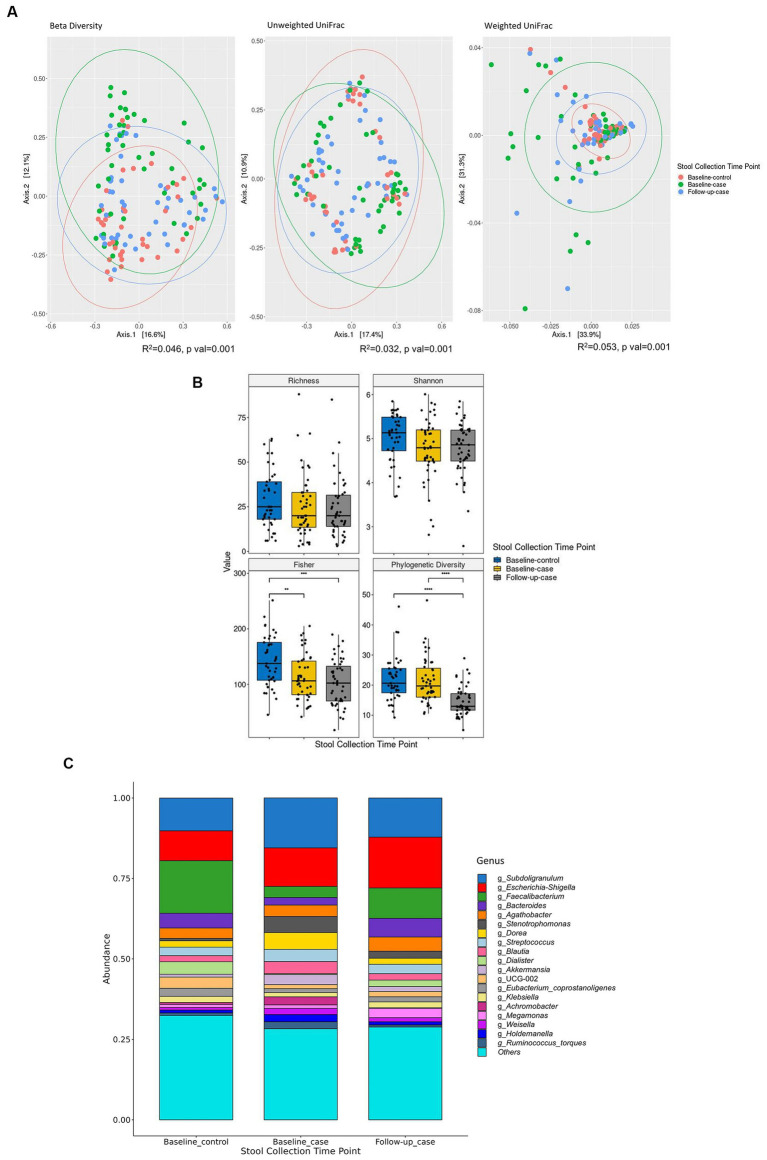
Figure 1.
Alpha and beta diversity of the cohort. Principal component analysis shows that the microbial abundance of each of the three condition-timepoints can be clustered together. Each dot represents each sample’s taxon abundance in two dimensions. Beta diversity is measured using Curtis-Bray, Unweighted UniFrac, and Weighted UniFrac distances (A). (B) Shows the diversity indices between condition-timepoint. The relative abundance of the 19 highest expressed genera in each condition-timepoint is shown in (C). Statistical significance is calculated by the Wilcoxon test. **p < = 0.01, ***p < = 0.001, ****p < = 0.0001.

