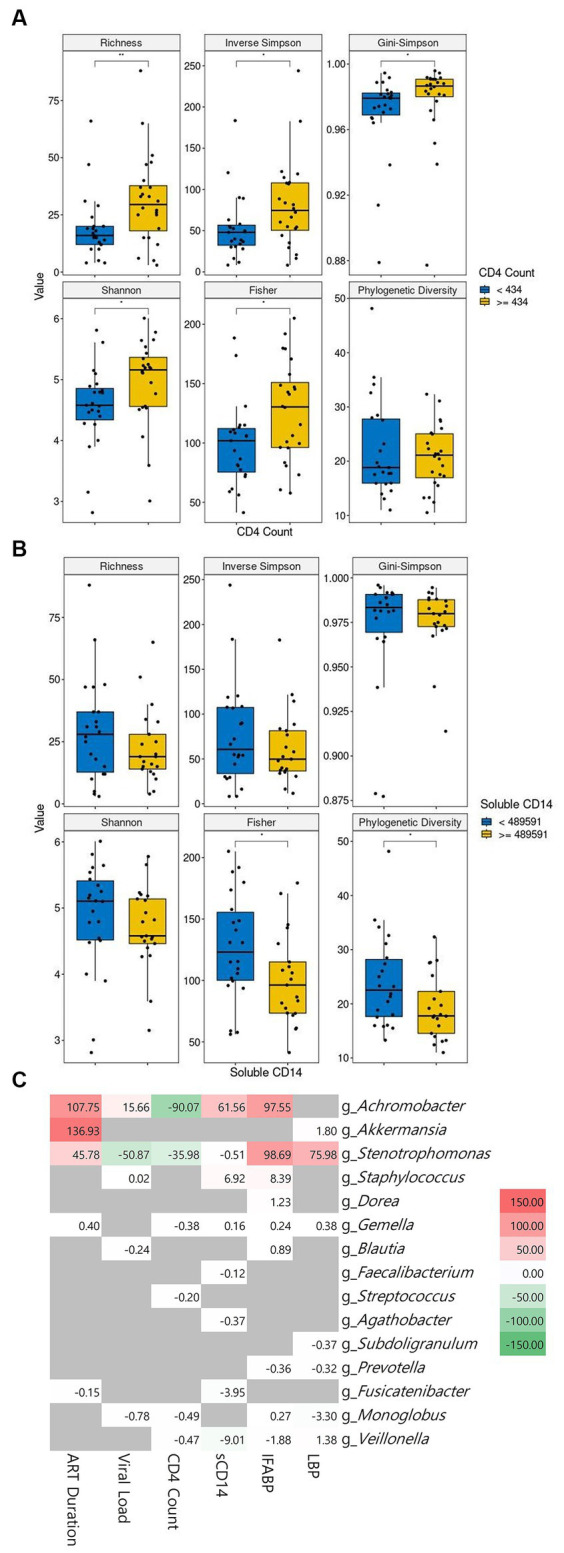
Figure 4.

The correlation of microbiome abundance with clinical features. The diversity indices between low and high CD4+ cell count are shown in (A). The diversity indices between low and high soluble CD14 level are shown in (B). The cutoff value between high and low is the median value. CD4+ T-cell count is in cells/μL of blood and soluble CD4 is in pg/mL of blood. The correlation between genera and clinical features is observable in (C). Statistical significance is calculated by the Wilcoxon test. **p < = 0.01, ***p < = 0.001, ****p < = 0.0001. ART: antiretroviral, sCD14: soluble CD14, IFABP: intestinal fatty acid binding protein, LBP: lipopolysaccharide-binding protein.
