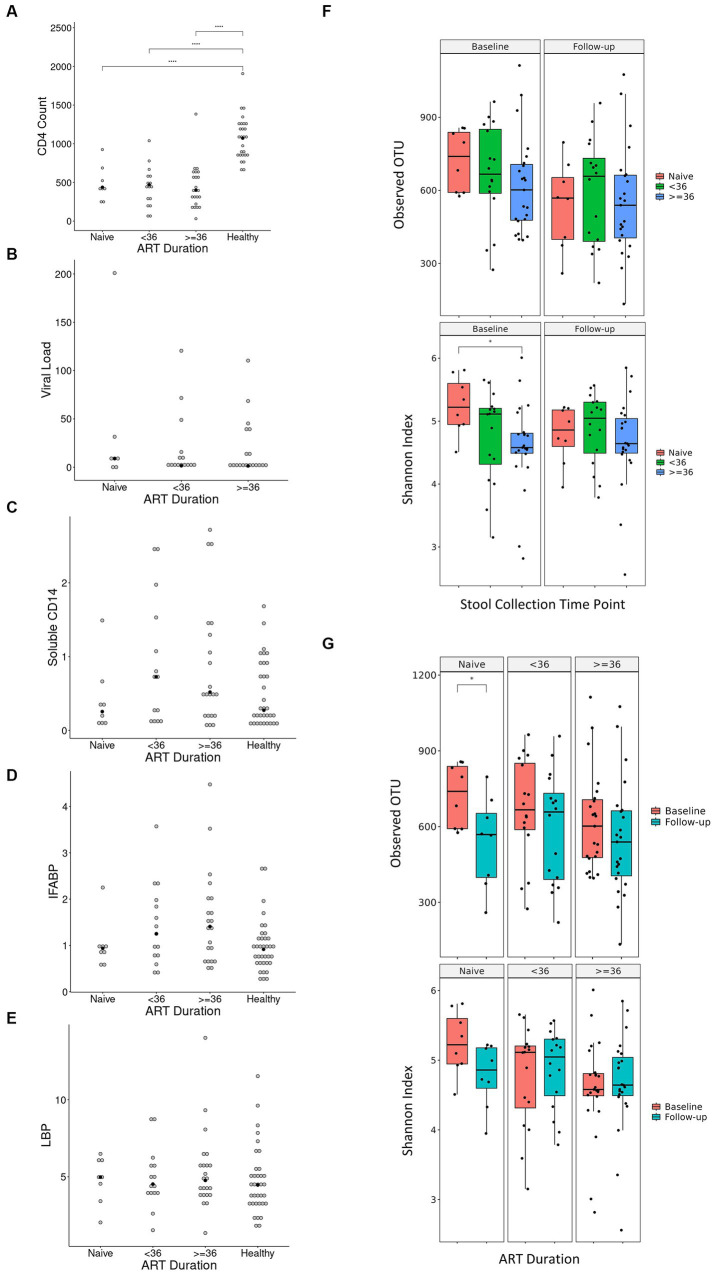
Figure 6.
Diversity indices and clinical features in regard to treatment duration. Values of CD4+ T-cell count, viral load, soluble CD14, IFABP, and LBP in regard to treatment duration is shown in (A–E), respectively. Antiretroviral (ART) duration is in months, CD4+ T-cell count is in cells/μL of blood, viral load is in copies/μL of blood, soluble CD14 is in μg/mL of blood, intestinal fatty acid binding protein (IFABP) is in ng/mL of blood, and lipopolysaccharide-binding protein (LBP) is in μg/mL of blood. Each white dot is the value of a sample while the black dots show the median value. Diversity indices in regard to duration treatment is shown in (F,G). Statistical significance is calculated by the Wilcoxon test. **p < = 0.01, ***p < = 0.001, ****p < = 0.0001.

