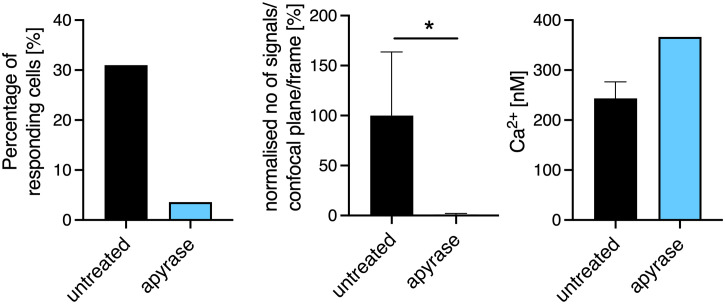
Figure 2.
Extracellular ATP (ATPe) influences the formation of Ca2+ microdomains in the first seconds after TCR stimulation. Initial Ca2+ microdomain imaging of CD8+ T cells of WT with and without addition of apyrase to the Ca2+ measurement buffer was performed with the Ca2+ indicators Fluo4 and FuraRed using anti-CD3/anti-CD28 coated beads. Bar charts show the percentage of responding cells (left panel), the normalized number of Ca2+ microdomains per frame for whole cells (per confocal plane, middle panel), the average Ca2+ amplitude of these signals are shown (right panel) 15s after bead engagement. Data are mean ± SEM, untreated n = 20 cells, apyrase n= 21 cells from 7 independent experiments. Results were analyzed using the Mann-Whitney test (*p < 0.05).

