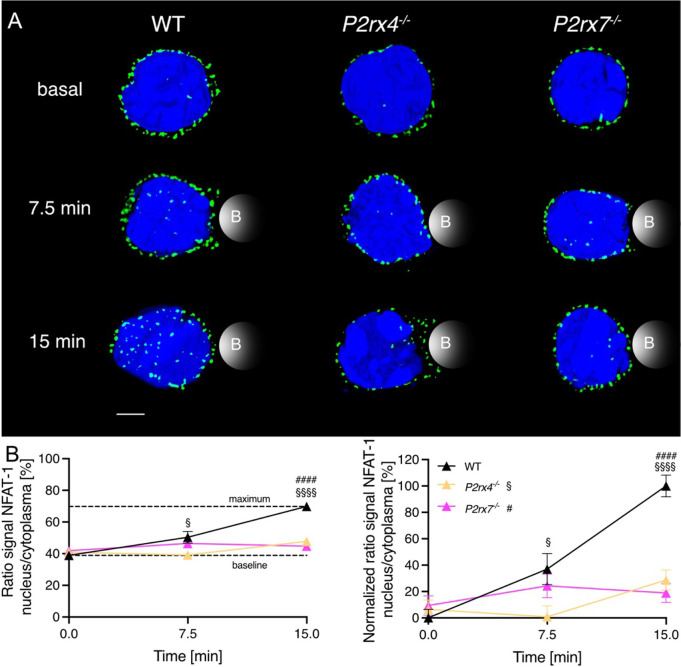
Figure 4.
The nuclear translocation of NFAT-1 is influenced by P2X4 and P2X7 minutes after TCR stimulation. CD8+ T cells of WT, P2rx4 -/- and P2rx7 -/- mice were activated with anti-CD3/anti-CD28 coated beads for 7.5 min and 15 min and NFAT-1 protein and the nucleus were stained. Three spleens per condition were used. (A) A representative cell for WT, P2rx4 -/- and P2rx7 -/- without stimulation (basal), and after 7.5 min and 15 min stimulation are shown. NFAT-1 is presented in green, the nucleus in blue. Bead contact is indicated schematically. Scalebar 2 µm. (B) The translocation of NFAT-1 is quantified by the ratio of the signal of NFAT-1 in the nucleus/cytoplasm (right panel). Approximation of the dynamic range using the maximal response, which was obtained with 15 min of bead stimulation in WT T cells and data were normalized to this dynamic range (left panel). Data are means ± SEM. Basal WT n = 61 cells, P2rx4 -/- n = 38 cells and P2rx7 -/- n = 56 cells. 7.5 min WT n = 29 cells, P2rx4 -/- n = 29 cells and P2rx7 -/- n = 33 cells. 15 min WT n = 35 cells, P2rx4 -/- n = 36 cells and P2rx7 -/- n = 24 cells. Data were compared using ordinary one-way ANOVA with Dunnett’s multiple comparisons test (P-values § for P2rx4 -/-, # for P2rx7 -/-, p §/# < 0.05, and p §§§§/#### < 0.0001).

