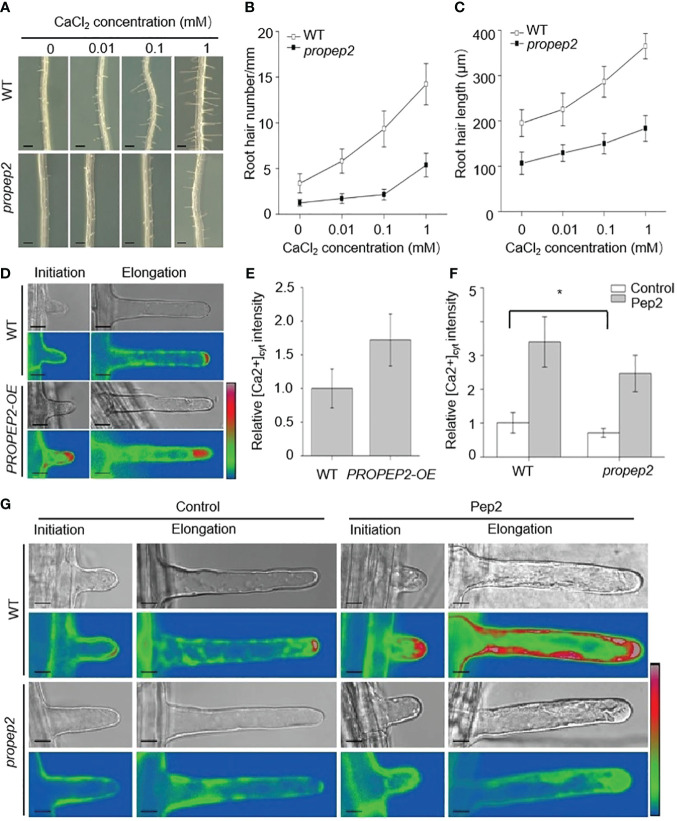
Figure 7.
PROPEP2 mediates the root hair development dependent on Ca2+ concentrations changes. (A) The growth phenotype of root hairs in wild type (WT) and propep2 mutant under CaCl2 treatment. Four-day-old plants were transplanted on half-strength Murashige and Skoog (MS) agar medium supplemented with or without 0.01, 0.1 and 1mM CaCl2 for 48 h. Bars = 200 μm. (B, C) Statistics of the root hair number (B) and root hair length (C) as in (A). Data are means ± SD (n = 15 roots per treatment). (D) Imaging of Ca2+ fluorescence signals in the initiation and elongation root hairs. The 6-day-old wild type (WT) and PROPEP2-overexpression line (PROPEP2-OE) expressing the genetically encoded intracellular Ca2+ indicator GCaMP6s were used. Bars = 10 μm. (E) Quantitative analysis of cytosolic Ca2+ signals in the elongation root hair as in (D), Relative fluorescence was normalized against that in WT root hairs (1.0). Data are mean ± SD; (n = 35 root hairs of 10 roots per treatment). (F) Quantitative analysis of cytosolic Ca2+ signals in the elongation root hairs of WT and propep2 plants, 6-day-old plants were transplanted on half-strength Murashige and Skoog (MS) agar medium supplemented with or without 10 nm Pep2 for 6 h. Relative fluorescence was normalized against that in WT root hairs without Pep2 treatment (1.0). Data are mean ± SD; (n = 35 root hairs of 10 roots per treatment). (G) Imaging of Ca2+ fluorescence signals in the initiation and elongation root hairs of WT and propep2 plants. Six-day-old WT and propep2 plants expressing GCaMP6s were transplanted on half-strength Murashige and Skoog (MS) agar medium supplemented with or without 10 nm Pep2 for 6 h. Bars = 10 μm. A pseudocolor scale bar for relative cytosolic Ca2+ level calibration in (D, G) is shown on the right. Asterisks in (F) indicate statistically significant differences compared with the untreated control. (Tukey’s test; *p < 0.05).

