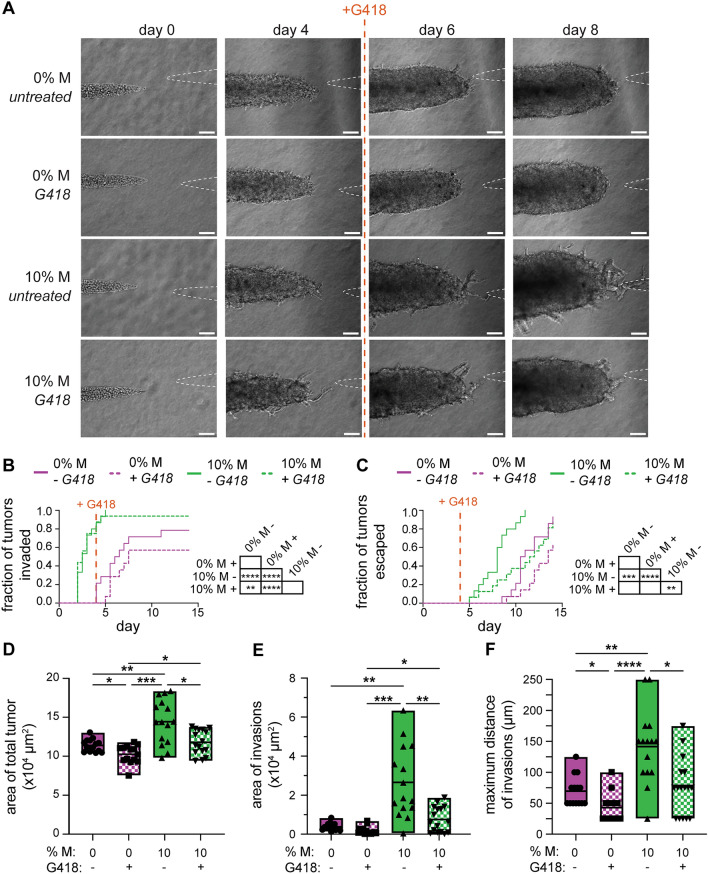
Fig. 8.
Targeting the relatively rare, invasive population after invasion delays escape. A Phase-contrast images of 0% or 10% M tumors treated with or without G418 on day 4. Kaplan–Meier plots of B invasion and C escape for 0% or 10% M tumors treated with or without G418 on day 4. Graphs of D area of the total tumor, E area of invasions, and F maximum distance of invasions of tumors treated with or without G418. Shown are data from 14 to 16 tumors for each condition, pooled over n = 3 independent experiments. Scale bars 100 µm. *p < 0.05; **p < 0.01; ***p < 0.001; ****p < 0.0001

