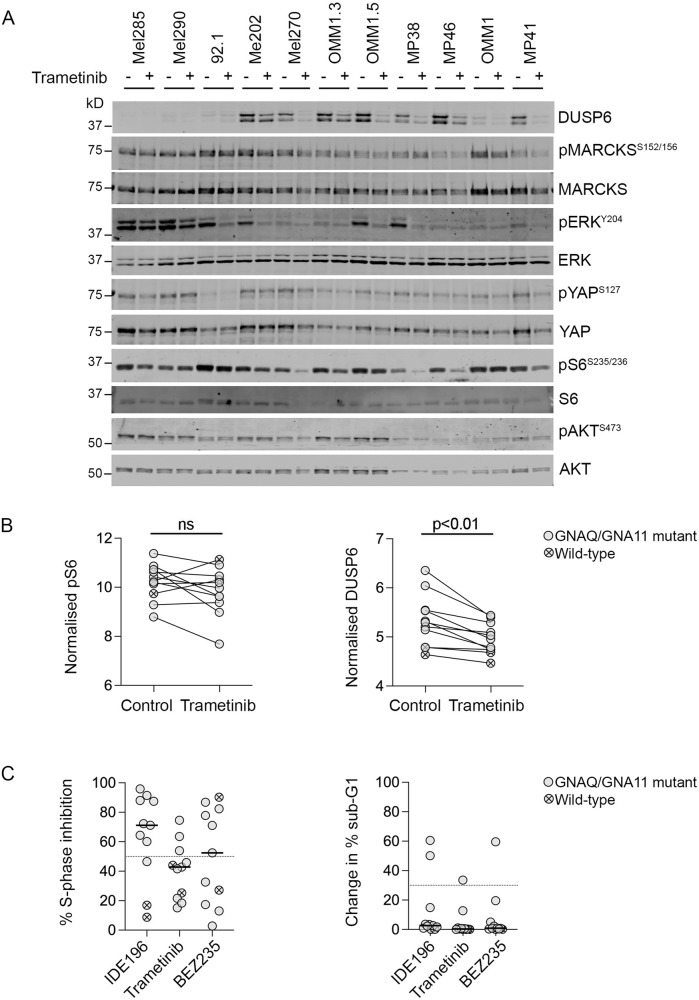
Fig. 2. Inhibition of MAPK signalling with Trametinib in UM cell lines.
A Accumulation of MAPK, PI3K/AKT, YAP and PKC signalling effectors including total and phosphorylated DUSP6, MARCKS, ERK, YAP, S6 and AKT 24 h after treatment with vehicle control (−) or 10 nM Trametinib (+). Western blot analyses were performed using three independent biological replicates (n = 3). kD kilodalton. REVERT total protein loading stain is shown in Supplementary Fig. S4. B Expression levels of pS6 and DUSP6 (normalised to total S6 or REVERT staining, respectively) in vehicle control or 10 nM Trametinib-treated GNAQ/GNA11-mutant (solid dot) or wild-type (crossed dot) UM cell lines. Data derived from three independent biological experiments (n = 3), and P values were calculated using paired t tests. ns not significant. C Percentage of cells undergoing S-phase inhibition (dotted line set at 50% S-phase inhibition) and change in % sub-G1 (dotted line set at 30% sub-G1) in GNAQ/GNA11-mutant (solid circle) or wild-type (crossed circle) UM cell lines treated with 5 µM IDE196 (data derived from [8]), 10 nM Trametinib or 2 µM BEZ235. Data derived from three independent biological experiments (n = 3).

