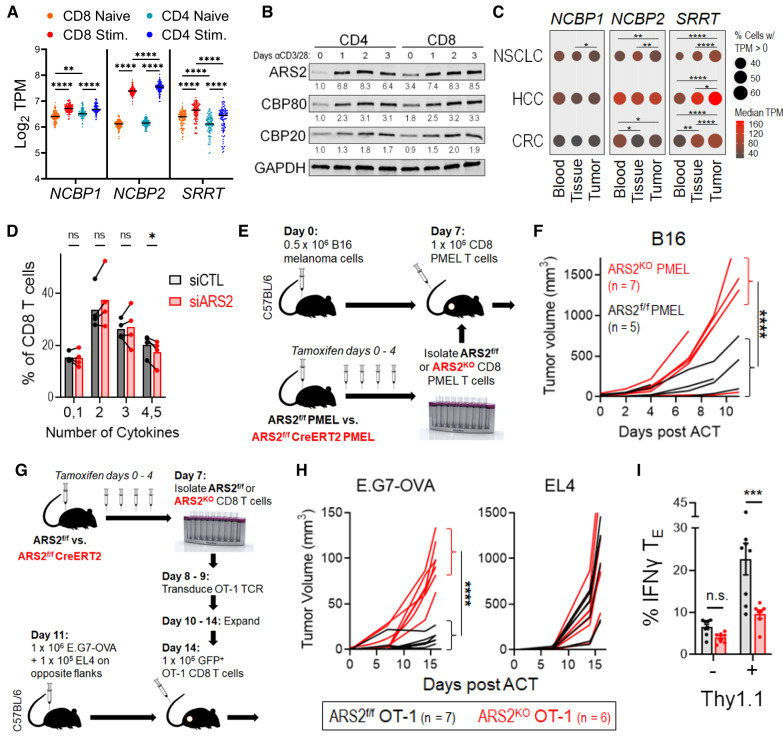
Fig. 1.
ARS2 supports CD8+ T-cell-mediated antitumor immunity A Violin plot showing the mRNA expression of the CBCA components CBP80 (NCBP1), CBP20 (NCBP2), and ARS2 (SRRT) in naïve compared with stimulated human CD4+ and CD8+ T cells; the data are from the DICE database (https://dice-database.org/). B Western blots showing the expression of CBCA components in separately isolated CD4+ or CD8+ human T cells stimulated with αCD3/αCD28 microbeads for the indicated number of days. The blots are representative of two healthy human donors. C Frequency (circle size) and magnitude (color) of CBCA component mRNA expression in single CD8+ T cells isolated from blood, adjacent normal tissue, or tumor tissue of patients with non-small cell lung cancer (NSCLC, data from GSE99254), hepatocellular carcinoma (HCC, data from GSE98638), or colorectal carcinoma (CRC, data from GSE108989). D Frequency of control compared with ARS2 siRNA-transfected healthy human donor CD8+ T cells expressing the indicated number of cytokines 3 days post transfection and stimulation with αCD3/αCD28 beads. Prior to intracellular staining for the cytokines shown in Supplementary Fig. 1J, T cells were restimulated for 4 h with PMA + ionomycin in the presence of brefeldin A. The bars indicate the means of 4 healthy human donors, and the connected points represent individual donors. E Schematic depicting the PMEL adoptive cell therapy (ACT) model used to compare antigen-specific antitumor immunity between ARS2f/f and ARS2KO CD8+ T cells. F Growth of subcutaneous B16 tumors following ACT with ARS2f/f (black line) or ARS2KO (red line) CD8+ T cells isolated from PMEL TCR transgenic mice. G Schematic depicting the ACT model used to compare antigen-specific antitumor immunity between ARS2f/f and ARS2KO CD8+ T cells following transduction with the OT-1 TCR transgene. H Growth of subcutaneous tumors following ACT with ARS2f/f (black line) or ARS2KO (red line) OT-1 TCR-transduced T cells. Isogenic E.G7-OVA OT-1 target and EL4 control tumor cells were implanted into opposite flanks. I IFNγ expression in E.G7-OVA tumor-infiltrating OT-1-transduced (Thy1.1+) and bystander (Thy1.1−) ARS2f/f (gray bars) or ARS2KO (red bars) TE cells. The bars indicate the means ± SDs, and the dots represent biological replicates. The lines in (F) and (H) represent individual tumors. Differences between groups were determined by ANOVA (A, C, D, I) or mixed effects analysis (F, H). ns = not significant, *p < 0.05, **p < 0.01, ***p < 0.001, ****p < 0.0001

