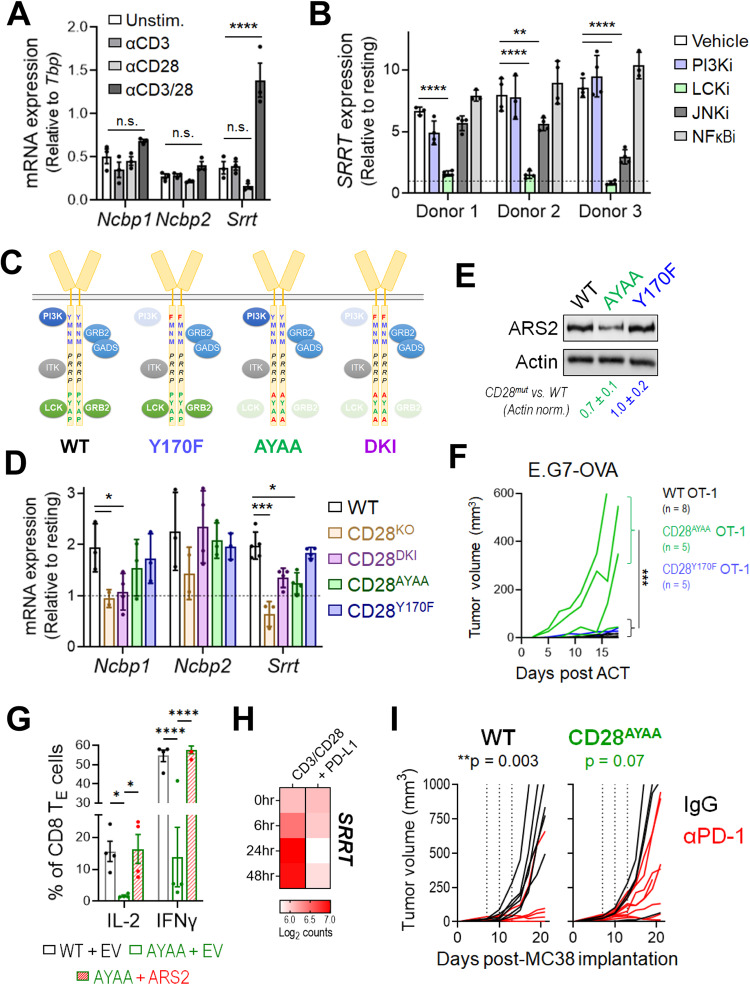
Fig. 2.
CD28 PYAP domain signaling regulates ARS2 expression and antitumor immunity A Expression of the mRNAs encoding the CBCA components CBP80 (Ncbp1), CBP20 (Ncbp2), and ARS2 (Srrt) in C57BL/6 J T cells stimulated with αCD3, αCD28, or αCD3 + αCD28 for 24 h. B Expression of the mRNA coding for ARS2 (SRRT) in CD8+ T cells isolated from healthy human donors (n = 3) and stimulated with αCD3 + αCD28 in the presence of the PI3K (1 μM LY294002), LCK (0.5 μM RK-24466), JNK (10 μM SP600125), or NFκB (4 μM BAY 11-7082) inhibitor. C Schematic depicting the CD28 intracellular signaling domain and associated signaling proteins in WT mice and CD28 mutant knock-in mice. D Expression of mRNAs encoding CBCA components in isolated WT C57BL/6 J, CD28 knockout, and CD28 mutant knock-in T cells stimulated with αCD3/αCD28 + rIL-2 for 24 h. E Representative Western blot showing ARS2 expression in isolated WT C57BL/6 J and CD28 mutant knock-in T cells stimulated with αCD3/αCD28 + rIL-2 for 72 h. The means ± SDs of the ARS2 band densities were quantified and normalized to the Actin band densities from three independent replicates (shown below the blots). F Growth of subcutaneous E.G7-OVA tumors following ACT with WT (black line), CD28Y170F knock-in (blue line) or CD28AYAA knock-in (green line) OT-1 TCR-transduced CD8+ T cells. The growth of isogenic EL4 control tumors from cells implanted into opposite flanks is shown in Supplementary Fig. 3D. G Rescue of IFNγ and IL-2 expression in activated CD28AYAA TE cells by ectopic expression of ARS2. H Expression of the mRNA coding for ARS2 (SRRT) in CD8+ T cells isolated from healthy human donors and stimulated with αCD3 + αCD28 ± recombinant PD-L1; the data are from GSE122149. I Growth of subcutaneous MC38 tumors in WT and CD28AYAA knock-in mice treated with either 200 μg of control rat IgG2a (black lines) or αPD-1 (clone 29 F.1A12, red lines) on Days 7, 10, and 13 following tumor implantation. The bars in (A, B, D, G) indicate the means ± SDs; the dots represent biological replicates. The lines in (F, I) represent individual tumors. Differences between groups were determined by ANOVA (A, B, D, G) or mixed effects analysis (F, I). ns = not significant, *p < 0.05, **p < 0.01, ***p < 0.001, ****p < 0.0001

