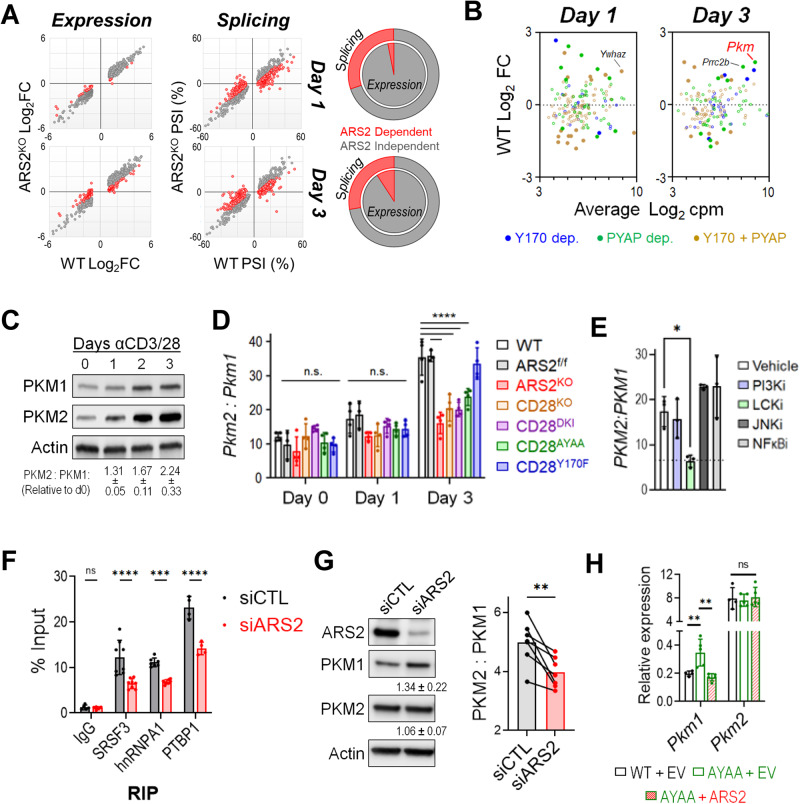
Fig. 3.
T-cell activation-induced alternative splicing of PKM is regulated by the CD28-ARS2 axis. A Effect of ARS2 deletion on T-cell activation-induced gene expression (left) or alternative splicing (right) on Day 1 (top) and Day 3 (bottom) following stimulation with αCD3/αCD28 + rIL-2. The red dots indicate significant differences between activated WT and ARS2KO T cells. The pie charts depict the contribution of ARS2 to differential gene expression (inner pie) and alternative splicing (outer pie) induced by T-cell activation. B Dot plot showing fold changes in the expression of genes whose alternative splicing was found to be ARS2 and CD28 dependent on Day 1 (left) or Day 3 (right) of T-cell activation in activated T cells compared with resting T cells. The dots are color coded based on CD28 signaling domain dependence. The filled dots represent DEGs in activated cells relative to resting cells. C Western blot analysis of PKM1 and PKM2 protein expression in human T cells stimulated with αCD3/αCD28-coated microbeads; representative of four normal donors. D Pkm2-to-Pkm1 ratio, as determined by qRT‒PCR, in WT, ARS2f/f, ARS2KO, CD28KO, CD28DKI knock-in, CD28AYAA knock-in, and CD28Y170F knock-in T cells following activation with αCD3/αCD28 + rIL-2 for the indicated number of days. Total Pkm expression is shown in Supplementary Fig. 4E. E PKM2-to-PKM1 ratio, as determined by qRT‒PCR, in human T cells activated for 3 days with αCD3/αCD28-coated microbeads in the presence of the indicated inhibitors, as described in Fig. 2B. F Binding of splicing factors to PKM pre-mRNA, as determined by RNA immunoprecipitation (RIP) followed by qRT‒PCR, in control siRNA- or ARS2 siRNA-transfected human T cells activated with αCD3/αCD28-coated microbeads for 3 days. G Western blot showing the expression of PKM1 and PKM2 in control compared with ARS2-knockdown human T cells on Day 3 of activation. The values below the blots are the mean expression levels in cells with ARS2 knockdown relative to those in control cells ± the SD values from 7 healthy donors. The bar graph on the right shows the average PKM2-to-PKM1 protein ratio, with the connected dots representing individual donors. Differences between groups were determined by paired t tests. H Expression of Pkm1 and Pkm2 on Day 3 of activation in empty vector (EV)-transfected WT T cells compared to CD28AYAA knock-in T cells transfected with either EV or ARS2. The bars in (D, E, F, H) indicate the means ± SDs; the dots represent biological replicates. Differences between groups were determined by ANOVA. ns = not significant, *p < 0.05, **p < 0.01, ***p < 0.001, ****p < 0.0001

