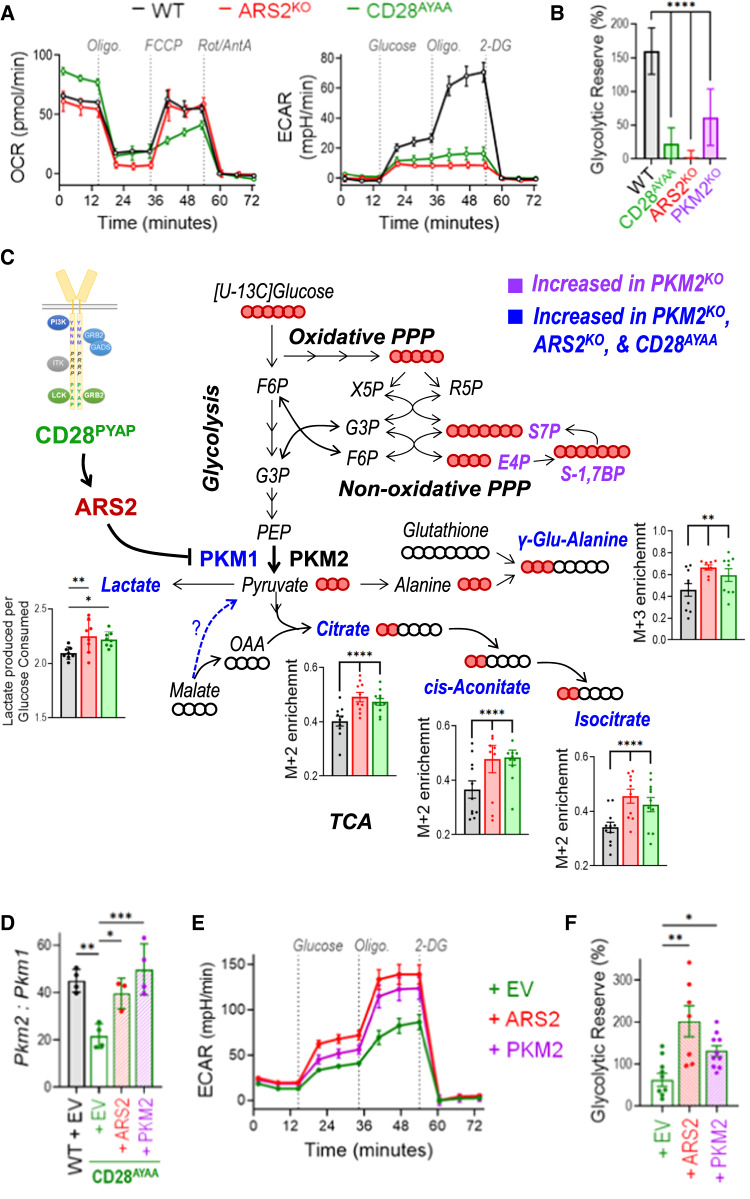
Fig. 5.
The CD28-ARS2-PKM2 axis imparts CD8+ T cells with metabolic flexibility. A Seahorse Mito (left) and Glycolysis (right) Stress Tests were performed on WT (black lines), ARS2KO (red lines), and CD28AYAA knock-in (green lines) T cells 72 h after activation with αCD3/αCD28-coated microbeads + rIL-2. B Quantification of the glycolytic reserve (maximum ECAR ÷ glucose-induced ECAR) in Day 3 activated T cells of the indicated genotypes. C Diagram of metabolic pathways influenced by the CD28-ARS2-PKM2 axis in Day 3 activated CD8+ T cells; the bar graphs show significant changes in ARS2KO (red bars) and CD28AYAA knock-in (green bars) cells. The abundances of the indicated isotopomers of the metabolites shown in blue were significantly increased in Day 3 activated CD28AYAA knock-in, ARS2KO, and PKM2KO CD8+ T cells, while those in purple were only increased in PKM2KO CD8+ T cells. The solid red balls represent 13C carbons, and the empty balls represent 12C carbons. D Pkm2-to-Pkm1 ratio on Day 3 after activation in WT T cells transfected with empty vector (EV) compared to CD28AYAA knock-in T cells transfected with EV, ARS2, or PKM2. E Seahorse Glycolysis Stress Tests were performed on Day 3 activated CD28AYAA knock-in T cells transfected with EV, ARS2, or PKM2. F Quantification of the glycolytic reserve in Day 3 activated CD28AYAA knock-in T cells transfected with EV, ARS2, or PKM2. The bars in (B, C, D, F) indicate the means ± SDs; the dots represent biological replicates. The Seahorse plots in (A, E) show representative results of experiments repeated at least 3 times. Differences between groups were determined by ANOVA. ns = not significant, *p < 0.05, **p < 0.01, ***p < 0.001, ****p < 0.0001

