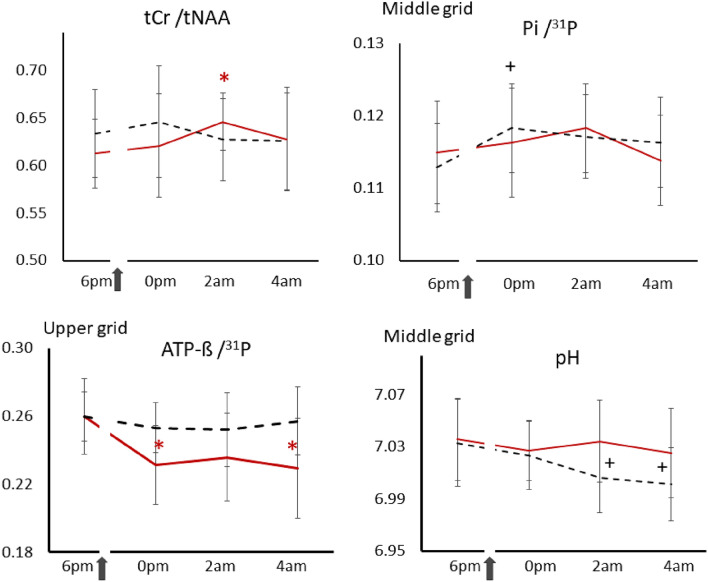
Figure 3.
Time courses of selected metabolic parameters during sleep deprivation after oral administration of creatine (red solid lines) or placebo (black dashed lines). Shown are tCr/tNAA of the voxel located in the left medial parietal region, and averages of Pi/31P, ATP-ß/31P and pH levels of the middle and upper grid voxels. 31P represents the total phosphorus signal, including PCr, Pi, ATP-ß, PE, and TCho. Arrows indicate administration of creatine or placebo at 8:30 p.m. Asterisks (*) represent significant changes versus baseline after creatine, and (+) after placebo administration (p ≤ 0.005) that survived the Bonferroni correction. Bars denote standard errors (SE).

