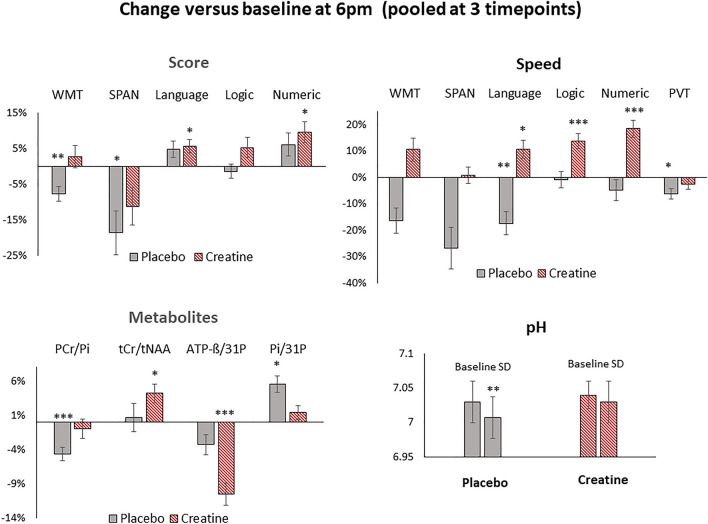
Figure 4.
Changes in cognitive performance and metabolites versus baseline (6 p.m.) during sleep deprivation under placebo (grey) and creatine (red) when pooled at all 3 timepoints (0 p.m., 2 a.m., 4 a.m.). Shown are changes in cognitive tasks (Language, Logic, Numeric), forward digit span (SPAN), word memory tasks (WMT), psychomotor vigilance test (PVT, reaction speed) and selected metabolic parameters of tCr/tNAA from the left medial parietal region, of PCr/Pi, Pi/31P and pH level from the averaged middle.-, and ATP-ß/31P from the averaged upper grid. Significance levels are presented by *p43 < 0.005, **p43 < 0.0005 and ***p43 < 0.00005. Bars represent standard errors (SE).

