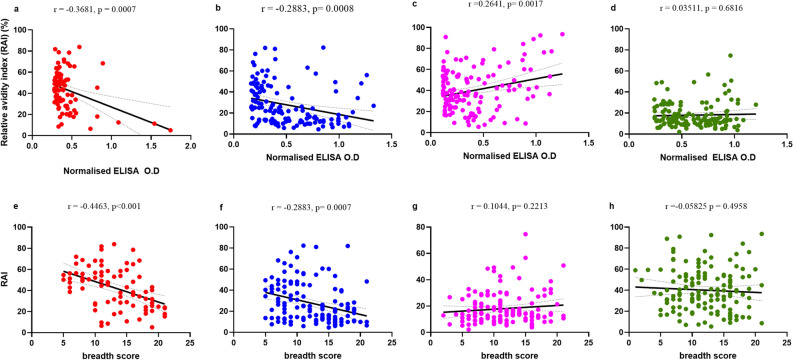
Figure 3.
Relationship between relative avidity index and antibody breadth score. Linear regression analysis (solid line) and 95% confidence interval (dashed line) between antibody breadth score of individuals living in Accra (top panel) and Cape Coast (lower panel) and relative avidity index, RAI (%) specific for CyRPA (A, E), MSRP5 (B, F), RAMA (C, G) and SERA9 (D, H). Spearman’s correlation coefficient r and p values are shown for each plot.

