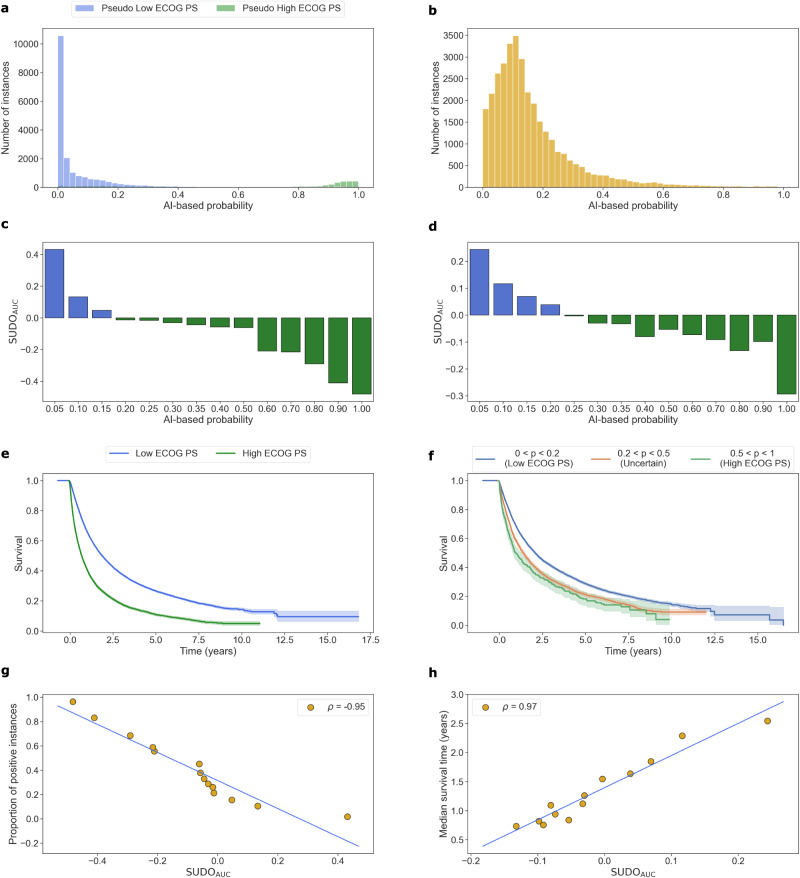
Fig. 4. SUDO correlates with model performance on the Flatiron Health ECOG Performance Status data without ground-truth annotations.
Results for (left column) test set with ground-truth annotations and (right column) data in the wild without ground-truth annotations. a, b Distribution of prediction probability values of NLP model. c, d SUDO values colour-coded with most likely label in each probability interval. Survival curves for patient groups identified via (e) ground-truth annotations and (f) SUDO values with low ECOG PS (0 < p < 0.2), high ECOG PS (0.5 < p < 1.0), and unreliable (0.2 < p < 0.5) predictions. The shaded area reflects the 95% confidence interval. g, h Correlation between SUDO and proportion of positive instances (using ground-truth annotations, ∣ρ∣ = 0.95 p < 0.005) and the median survival time of patients (without ground-truth annotations, ∣ρ∣ = 0.97 p < 0.005) in each probability interval. P-values are calculated based on a two-sided t-test. ECOG Eastern Cooperative Oncology Group, PS Performance Status.

