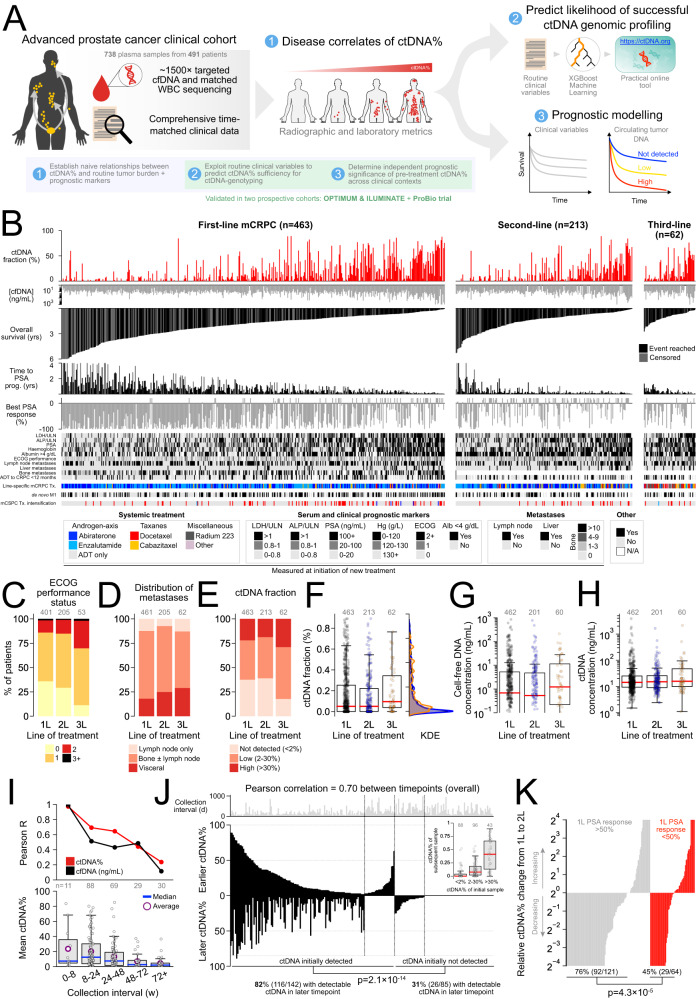
Fig. 1. Clinical mCRPC cohort with comprehensive clinical annotation and ctDNA-fraction estimates.
A Study overview. B Per-patient summary of clinical prognostic metrics and treatment outcomes stratified by line of mCRPC therapy, illustrating approximate relationships between high ctDNA-fraction (ctDNA%) (see Supplementary Data 2) and poor prognosis (see Supplementary Data 1 for complete list of clinical variables). All variables (including ctDNA%) are measured at time of line-specific mCRPC treatment initiation except for pre-mCRPC clinical history and diagnostic metrics (i.e., time from androgen deprivation therapy (ADT) initiation to CRPC diagnosis, de novo metastatic diagnosis, and treatment intensification for metastatic castration-sensitive prostate cancer (mCSPC)). Bars representing right-censored time-to-event clinical endpoints are colored gray (events reached are black). Patients whose best PSA response was rising PSA (i.e., nadir at baseline) have been truncated at a fixed positive value. Note that bone metastases were only enumerated in the first-line context, although all patients (independent of treatment line) were evaluated for bone lesion presence/absence. Temporal consistency of key patient clinical characteristics (C, D) and plasma cfDNA and ctDNA measurements (E–H) per initiating line of treatment. Number of patients with evaluable data matched to line of treatment annotated above (see Supplementary Data 3). I Correlation between consecutive same-patient ctDNA% and cfDNA concentration measurements taken at sequential clinical progressions as a function of collection interval. J Mirrored barplot showing same-patient ctDNA% across 227 consecutively collected cfDNA sample pairs (p-value reflects Fisher’s Exact Test). In-set boxplot is centered at median and displays interquartile ranges (IQR) and minima and maxima extending to 1.5× IQR. K Serial ctDNA% dynamics are associated with PSA response on intervening treatment. Relative ctDNA% change from initiation of first-line mCRPC therapy to initiation of second-line therapy in patients who did or did not achieve a PSA response ≥50% to first-line treatment. Fisher’s Exact Test compares proportion of patients in each category with serially decreasing ctDNA%. All p-values are two-sided. Yrs years, Tx treatment, PCa prostate cancer, prog. progression, w weeks, KDE kernel density estimation, ULN upper-limit of normal.

