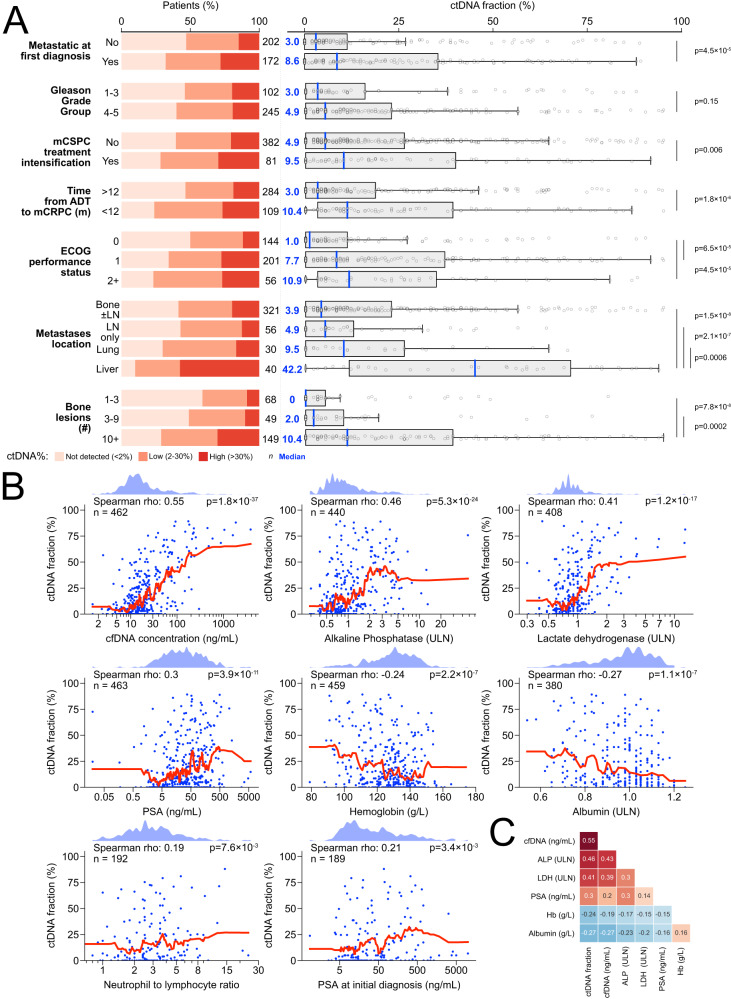
Fig. 2. Serum and radiographic prognostic clinical features correlate with baseline ctDNA fraction.
A Fraction of patients with ctDNA>30%, ctDNA 2-30%, and ctDNA<2% (left) and ctDNA% as a continuous variable (right) across various categorical clinical subgroups. Note that the “bone ± lymph node” category excludes patients with visceral metastases, and the “lung” category excludes patients with liver metastases; the “liver” category does not exclude any other metastatic subgroup. P-values reflect Mann-Whitney U tests and are two-sided; boxplots are centered at the median and display interquartile ranges (IQR) and minima and maxima extending to 1.5× IQR. B Correlation between ctDNA% and eight continuous prognostic serum markers. K-nearest neighbor regression (neighbors = 20 with uniform weights; red line) is used to nonparametrically visualize each bivariate relationship (i.e., avoids making assumptions about how ctDNA% is linked to each clinical factor). Kernel density estimates shown above. Spearman p-values are two-sided. C Correlation matrix showing that most serum prognostic markers are co-correlated. Spearman’s rho is annotated. See Supplementary Data 2 for per-patient ctDNA% values. mCSPC metastatic castration sensitive prostate cancer, ADT androgen deprivation therapy, m months, LN lymph node, Hb hemoglobin, PSA prostate-specific antigen, ULN upper limit of normal.

