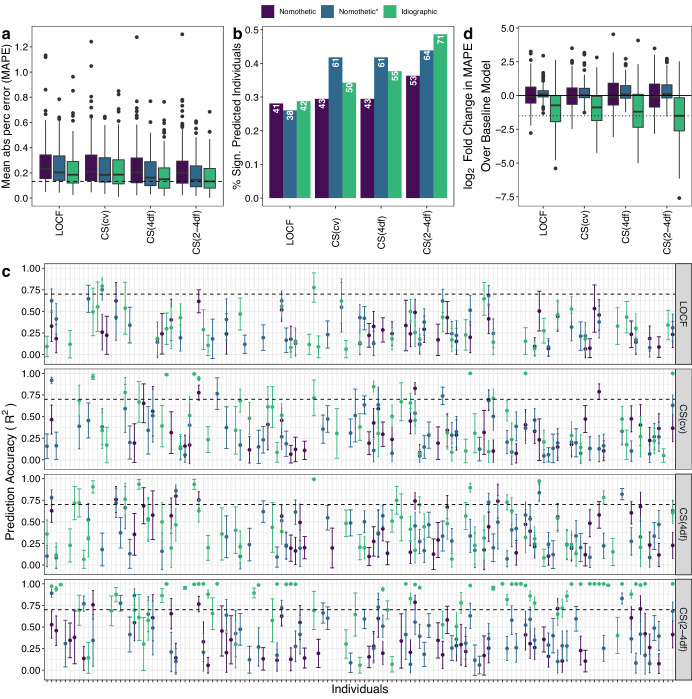
Fig. 5. Idiographic models achieve higher individual level prediction accuracy than nomothetic models.
a Box plots of distribution of MAPE across individuals for different models and latent depression traits. The dashed line indicates the median MAPE of the best performing model/latent trait combination, i.e., idiographic model and CS(2-4df) spline. b Bar plots of the proportion of individuals with significantly predicted mood (R > 0 at FDR < 5% across individuals) for each latent trait and prediction model. c Prediction accuracy (R2) with 95% CI across all individuals and latent traits. d Box plot of log2 fold change in CAT-DI prediction accuracy, as measured by MAPE, of feature-based model over the baseline model. Negative log2 fold change in MAPE mean that the feature-based model performs better than the baseline model. All plots are based on individuals with at least five assessments in the test set (N = 143). Features were imputed with Autocomplete and CAT-DI was modeled using a logistic elastic net regression. In (a, d), the dark black line represents the median value; the box limits show the interquartile range (IQR) from the first (Q1) to third (Q3) quartiles; the whiskers extend to the furthest data point within Q1-1.5*IQR (bottom) and Q3 + 1.5*IQR (top). LOCF: last observation carried forward. CS(xdf) cubic spline with x degrees of freedom, CS(cv) best-fitting cubic spline according to leave-one-out cross-validation.

