Figure 5.
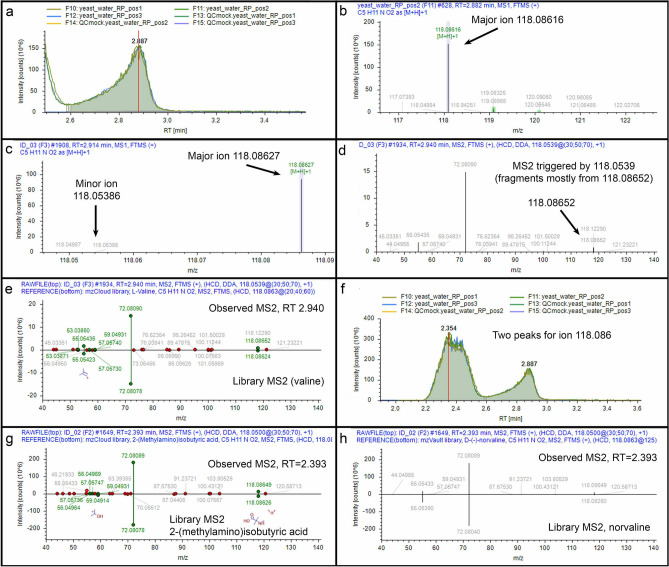
Example 2. (a) Chromatographic representation of m/z 118.08616 ion; (b) MS1 spectrum for detected ion m/z 118.08616; (c) Corresponding MS1 spectrum for associated major m/z 118.08627 ion and minor m/z 118.05386 ion; (d) Corresponding MS2 spectrum from preceding parent MS1 m/z 118.0539 ion; (e) Mirror plot of match (score 88.9) between fragment ions of MS2 spectrum from parent MS1 m/z 118.0539 ion (top) and reference MS2 spectrum for valine in mzCloud (bottom); (f) Chromatographic representation of two peaks for ion m/z 118.086; (g) Mirror plot of match (score 83.7) between fragment ions of MS2 spectrum from parent MS1 m/z 118.0500 ion (top) and reference MS2 spectrum for 2-(methylamino)isobutyric acid in mzCloud (bottom); (h) Mirror plot of match (score 90.8) between fragment ions of MS2 spectrum from parent MS1 m/z 118.0500 ion (top) and reference MS2 spectrum for norvaline in NIST_2020_MSMS (bottom).

