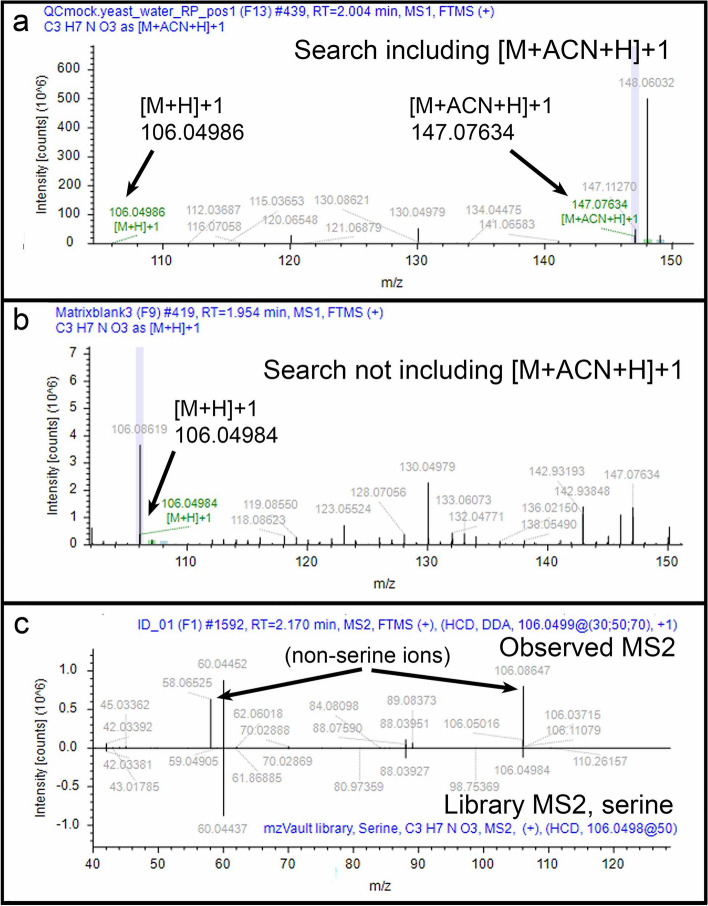
Figure 9.
Example 6. (a) MS1 spectrum for detected [M+H]+1 m/z 106.04986 ion and associated [M+ACN+H]+1 ion when the CD3.3 Detect Ions node included a search for [M+H]+1 and [M+ACN+H]+1 ions; (b) MS1 spectrum for detected [M+H]+1 m/z 106.04984 ion (but not the [M+ACN+H]+1 ion) when the CD3.3 Detect Ions node included a search for only the [M+H]+1 ion; (c) Mirror plot of match (score 69.7) between fragment ions of MS2 spectrum from parent MS1 m/z 106.0499 ion (top) and reference MS2 spectrum for serine in NIST_2020_MSMS (bottom).

