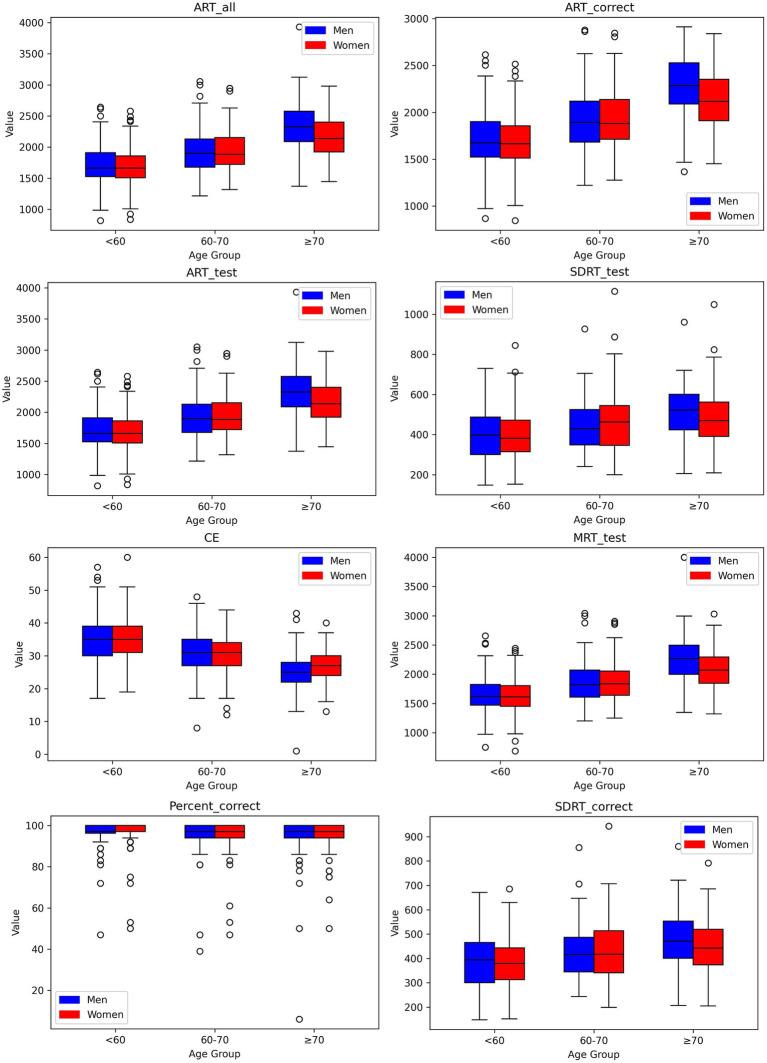
Figure 1.
Box-and-whisker plots showing distributions of digital measures of Code Substitution task by age group for men and women. Each box encompasses the middle 50% of the dataset, specifically the second and third quartiles. The reference value (median) is indicated by the internal horizontal line. Whiskers extend from the boxes to the highest and lowest values within 1.5 times the IQR from the upper and lower quartiles, respectively.

