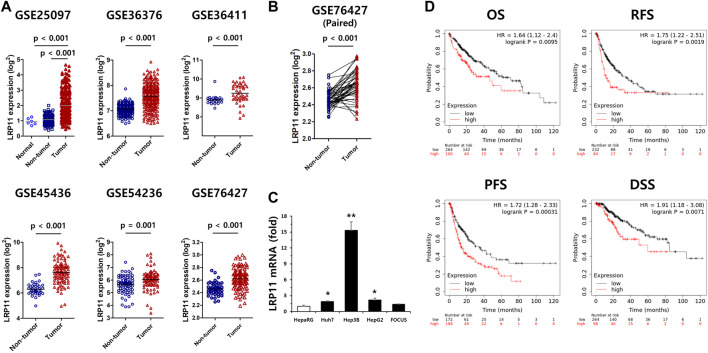
FIGURE 2.
Validation of LRP11 expression and prognostic value of LRP11 in LIHC. (A) Validation of LRP11 expression in cohorts from the independent GEO dataset including GSE25097 (normal n = 5, non-tumor = 243, tumor = 268), GSE36376 (non-tumor n = 193, tumor = 240), GSE36411 (non-tumor n = 21, tumor = 42), GSE45436 (non-tumor n = 39, tumor n = 95), GSE54236 (non-tumor n = 80, tumor = 81), and GSE76427 (non-tumor n = 52, tumor n = 115). (B) The expression level of LRP11 in paired non-tumor (n = 52) and tumor tissues (n = 52) from the GSE76427 dataset. (C) Upregulation of LRP11 in LIHC cell lines. qRT-PCR were performed in 5 different liver cell lines. Data represent means ± s.e.m. *: vs. HepaRG. *p < 0.05 and **p < 0.01. (D) The prognostic value of the expression of LRP11 in Kaplan-Meier plotter: overall survival (OS), relapse-free survival (RFS), progression-free survival (PFS), and disease-specific survival (DSS). LRP11 expression levels; p-values derived from the log-rank test are indicated in each comparison and the " best cutoff " for LRP11 mRNA was used.

