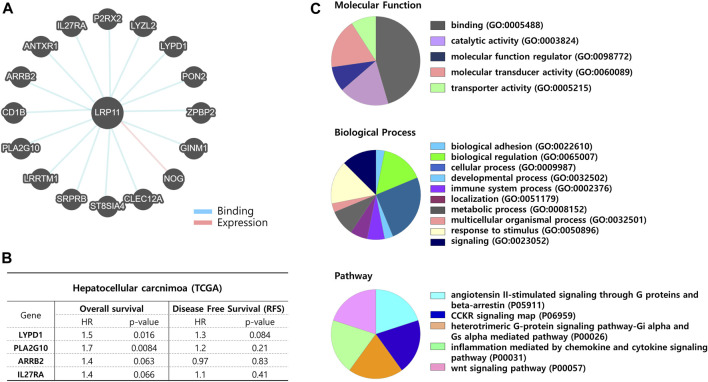
FIGURE 8.
Network analysis between LRP11 and interacting proteins. (A) Diagram of potential interacted proteins with LRP11 by Pathways Commons. (B) Interacting protein list of statistically significant between prognosis and LRP11 expression in LIHC-TCGA. (C) Pie charts showing the molecular function, biological process, and pathway class from PANTHER database.

