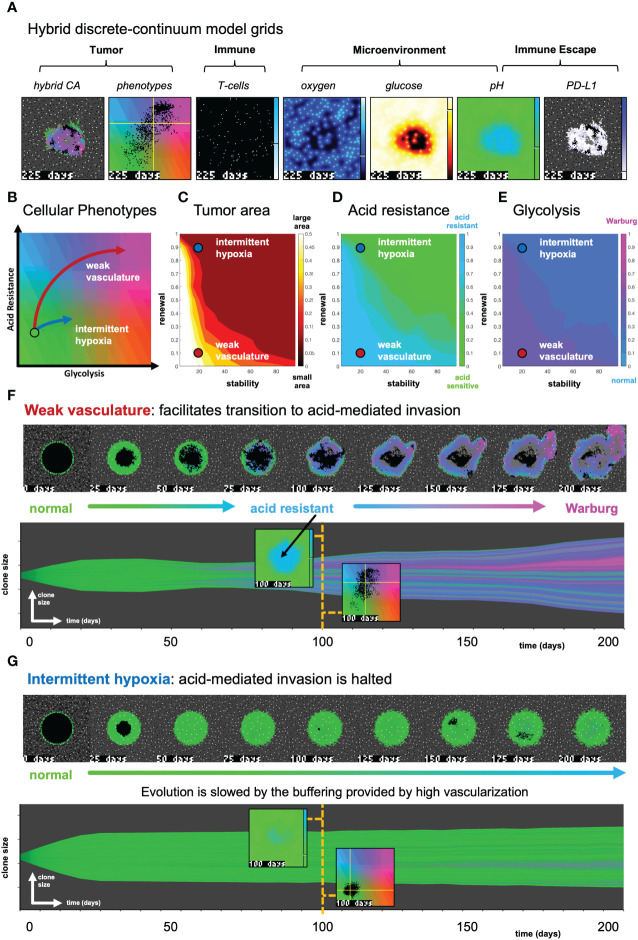
Figure 3.
The effect of vasculature renewal and stability on tumor size and phenotype. (A) Hybrid discrete-continuum model grids. (B) Schematic of phenotypic trajectory of weak versus intermittent hypoxia vascular conditions. (C–E) N = 10 stochastic realizations are simulated, and the average tumor area (C), acid resistance phenotype (D), and glycolytic phenotype (E) across 10 values of stability (νmean ∈ [0,100] days), and 10 values of renewal (pang ∈ [0,1]). (F) An example of “weak vasculature” (νmean = 20; pang = 0.1). Acidic conditions in tumor core select for acid resistant and glycolytic Warburg phenotype. (G) An example realization of “intermittent hypoxia” (νmean = 20; pang = 0.9), where selection is limited because of adequate vascularization within the tumor core. See associated Supplementary Video S2.

