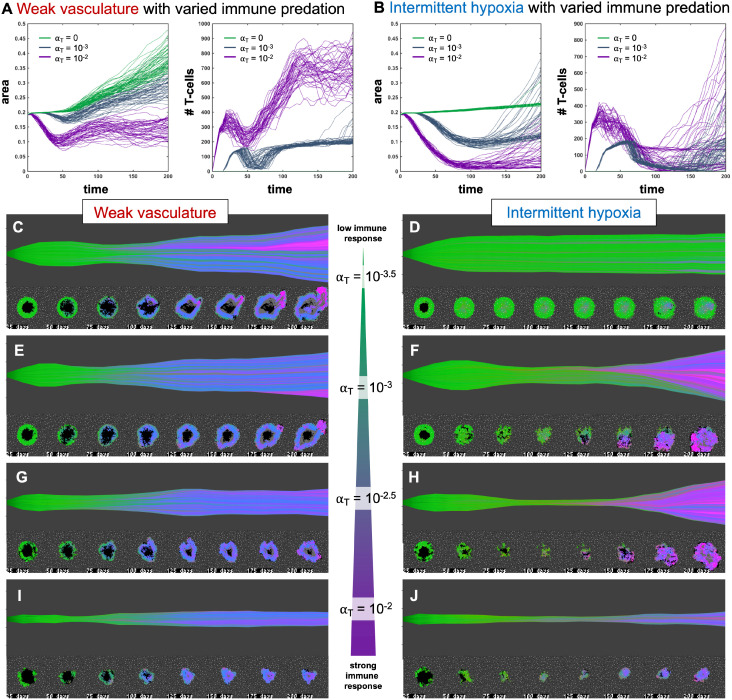
Figure 4.
Immune predation induces an evolutionary bottleneck. (A, B) Tumor area over time (left) and the number of T-cells for weak vasculature (A) and intermittent hypoxia vasculature (B) conditions), shown for no T-cells (green; αT = 0), medium (blue-gray; αT = 10−3) and high (purple; αT = 10−2) immune response rates. (C–J) Example simulation stochastic realizations are shown across a range of immune response from low (top) to high (bottom). Immune predation tends to suppress tumor growth in weak vasculature conditions. In contrast, immune predation induces an evolutionary bottleneck for medium immune response rates (e.g. see F, H), causing aggressive tumor growth compared to the baseline of no immune response.

