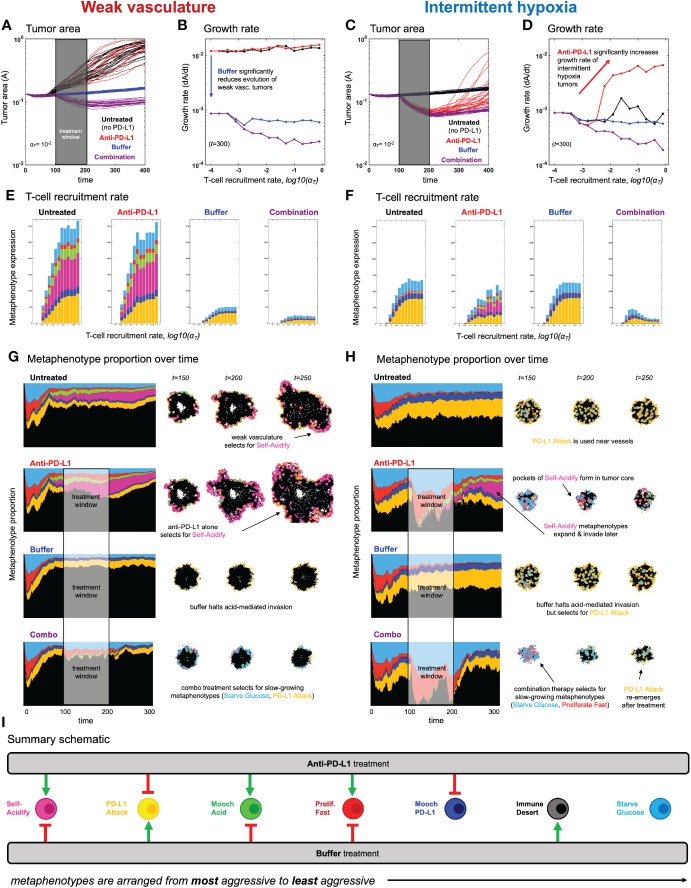
Figure 5.
Evolution of metaphenotypes under treatment. Outcomes of tumor response and immune escape can be explained by observing the evolution of metaphenotypes under treatment with anti-PD-L1 (red) and buffer (blue), given in isolation or combination (purple). (A) Tumor area over time (weak vasculature) (B) growth rate over time (weak vasculature). (C) Tumor area over time (intermittent hypoxia vasculature) (D) growth rate over time (intermittent hypoxia vasculature). (E, F) Final distribution of metaphenotypes (exlcuding Immune Desert, see Supplementary Figure S7) at t = 300, repeated for weak vasculature (E) and intermittent hypoxia (F). (G, H) Muller plots showing the frequency of metaphenotypes over time in untreated and mono- or combination therapy, with snapshots of spatial configurations during and after treatment, with moderate immune predation (αT = 10−2). See associated Supplementary Videos S3, S4 and Supplementary Figure S7. (I) Summary schematic. Each metaphenotype is ordered from most aggressive to least aggressive in facilitating acid-mediated invasion and tumor growth under immune predation. This interaction diagram describes the role of two treatments (anti-PD-L1, buffer) in promoting (green) or inhibiting (red) each metaphenotype. Metaphenotypes names are shown on the left, and defined mathematically in Box 2. Broadly, the two treatments offset one another by inhibiting the metaphenotypes that the opposite treatment promotes.

