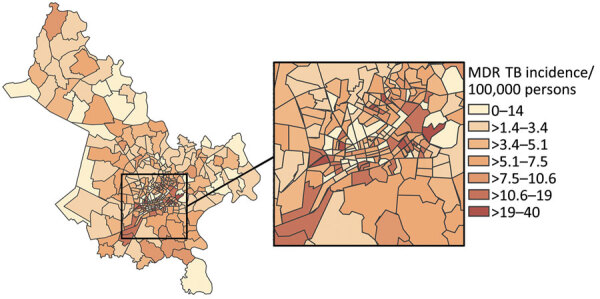
Figure 3.

Choropleth map displaying geographic variation in average annual incidence (cases/100,000 persons) for MDR TB, subdivided by ward, Ho Chi Minh City, Vietnam, January 1, 2020–April 30, 2023. Map does not include Cần Giờ district. Inset map shows location of study area in Vietnam. MDR TB, multidrug-resistant tuberculosis.
