
FIGURE 3.
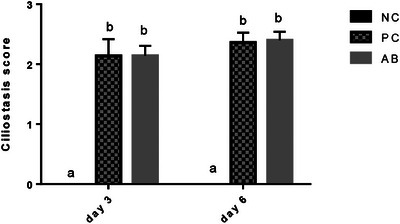
The ciliostasis scores (mean and SD) of tracheal samples from birds in different groups on days 3 and 6 post‐challenge with H9N2 and infectious bronchitis viruses. Different superscript letters show significant difference among columns in one sampling time point (p < 0.05).