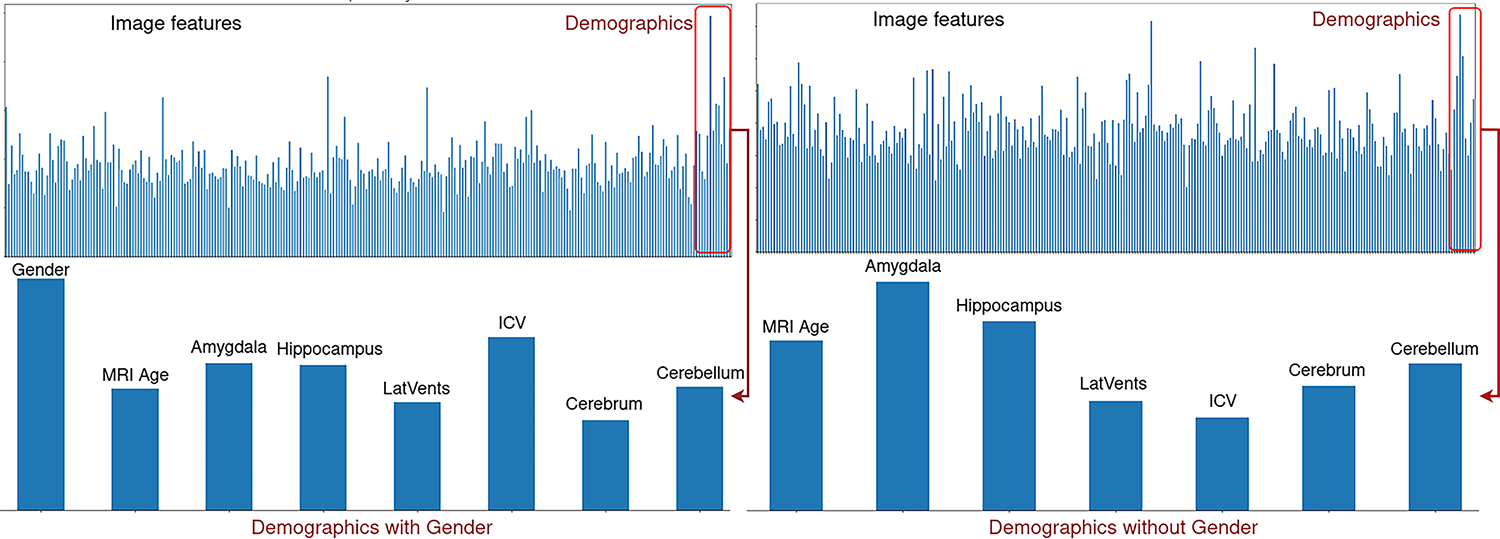
Fig. 4.

The top left figure shows a plot of importance for features concatenated with normalized demographic values. The bottom left is only demographics to highlight that gender is the most important feature for the Random Forest classifier. The right plot shows an experiment with the gender removed from the analysis and shows that the amygdala is the most important feature in the demographics for the classification task.
