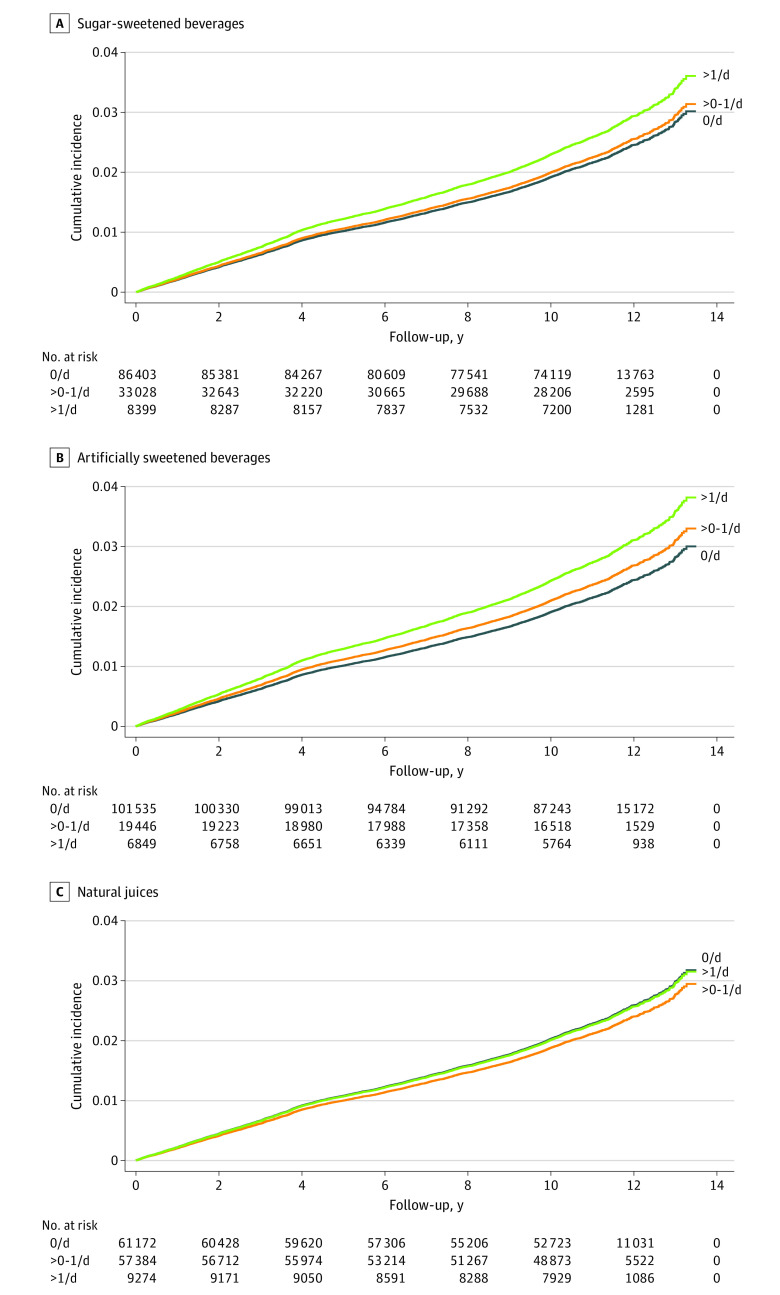
Figure 2. Adjusted Survival Curves for Incident Chronic Kidney Disease According to Category of Beverage and Level of Intake.
Curves are adjusted for age, sex, ethnic background, Townsend Deprivation Index, alcohol consumption status, smoking status, body mass index, physical activity, comorbidity (hypertension, diabetes, and cardiovascular disease), use of medication (renin-angiotensin-aldosterone system inhibitor and statins), dietary intake (total energy, total sugar, and healthy diet score), and laboratory measurements (estimated glomerular filtration rate, urine albumin to creatinine ratio, low-density lipoprotein cholesterol, and high-sensitive C-reactive protein).

