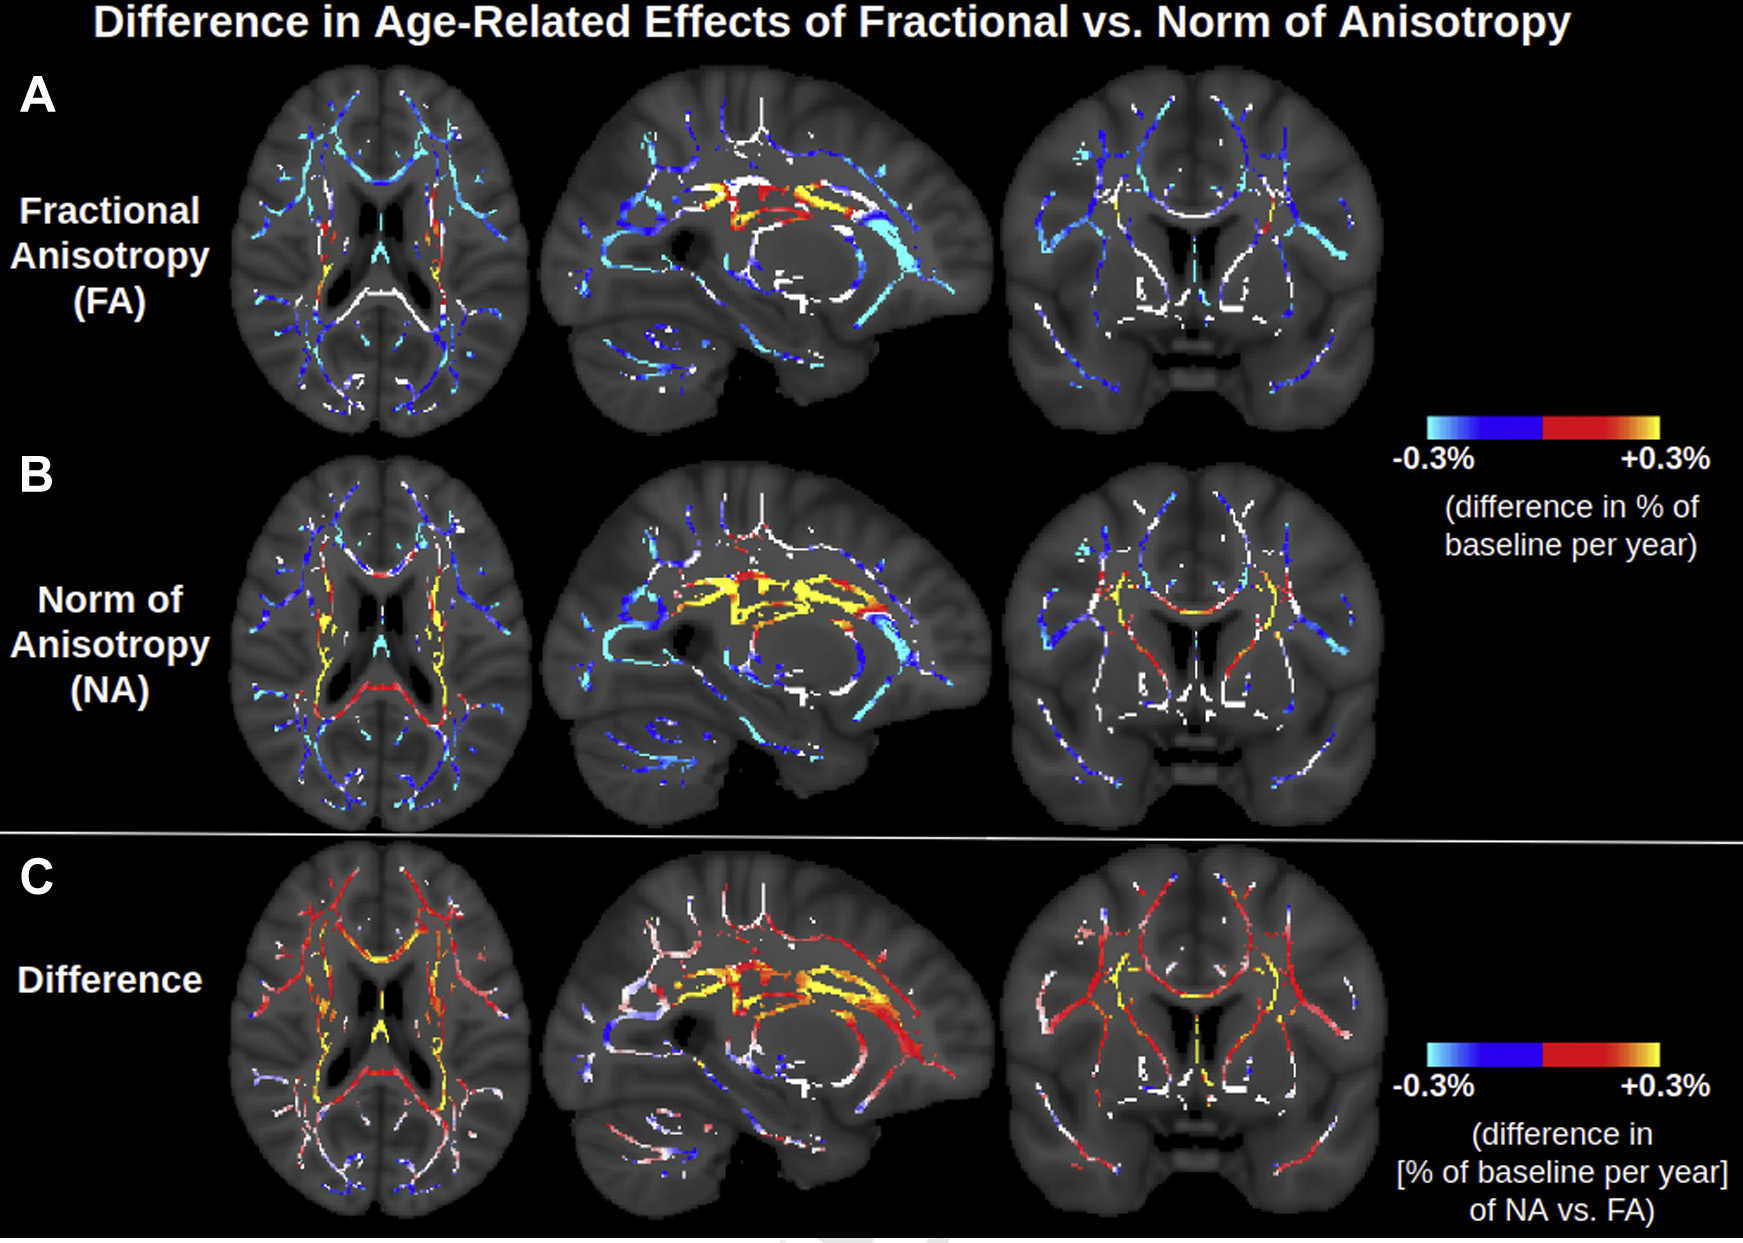
Fig. 4.

Difference in age-related effect of fractional anisotropy versus norm of anisotropy. Units are the slope of the regression line divided by the baseline of each metric, where “baseline” is defined as the average of the metric in the voxel for participants aged 46–50 years. The red-yellow in c indicates voxels where FA decreases with age faster than NA, that is, voxels exhibiting higher isotropic diffusivity with advancing age. The blue in c indicates regions where isotropic diffusivity is unassociated with age, and thus NA decreases with age slightly faster than FA, as described mathematically in Appendix A. Abbreviations: FA, fractional anisotropy; NA, norm of anisotropy. (For interpretation of the references to color in this figure legend, the reader is referred to the Web version of this article.)
