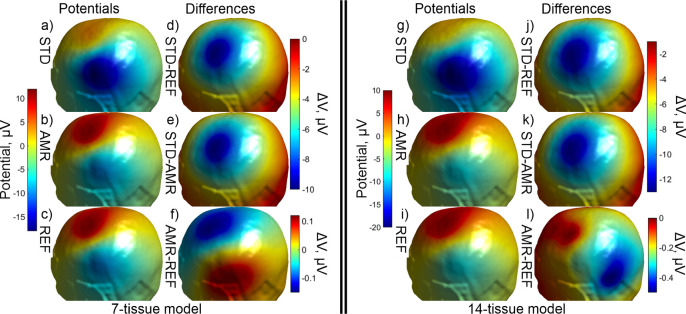
Figure 11.
(a)–(c): standard, adaptive, and reference (respectively) solutions for the potential (μV) in the observation region for the 7-tissue model of Connectome Subject 122620. (d)–(f): signed error in potential is shown between STD/REF, STD/AMR, and AMR/REF solutions respectively. Note the difference in colorbar scales between (d)–(e) and (f). (g)–(l): solutions and differences for the 14-tissue model.

