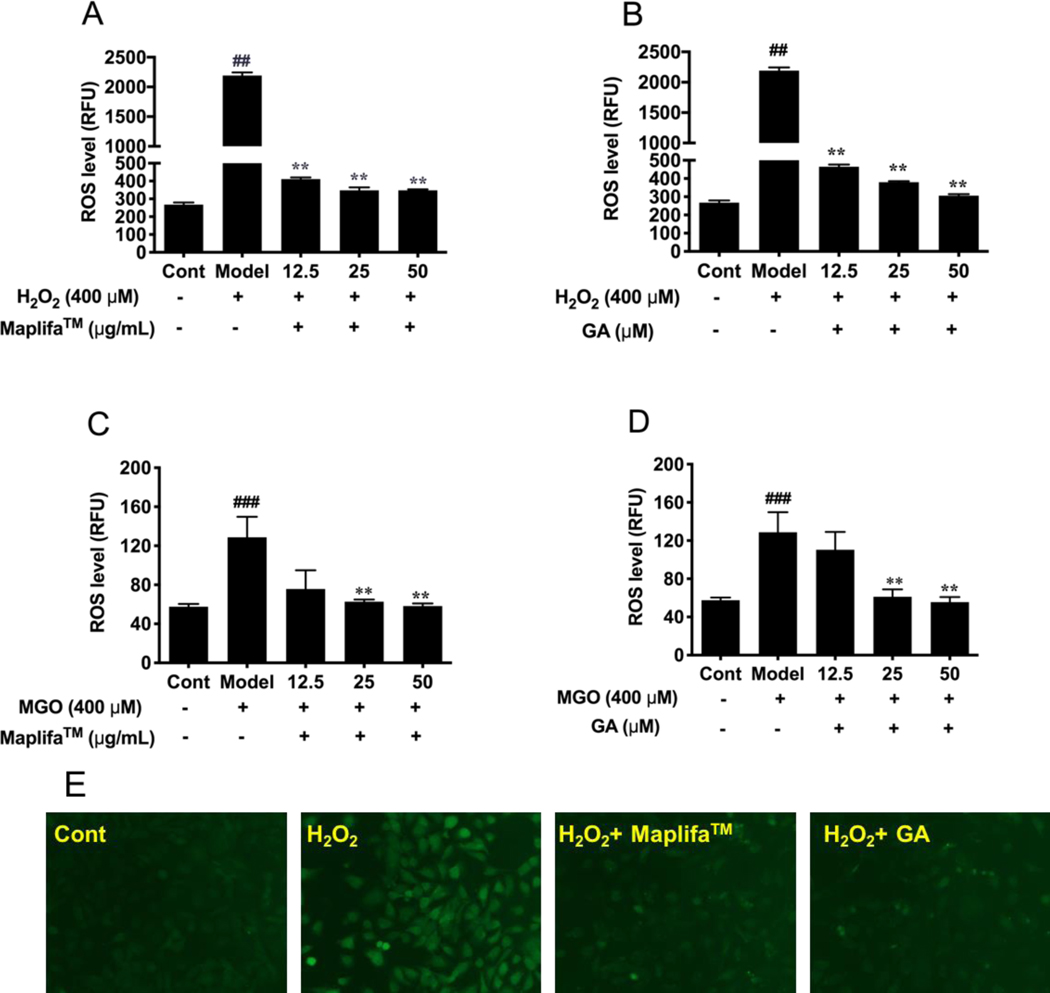
Fig. 3.
Effects of Maplifa™ and GA on the H2O2− and MGO-induced ROS production. Cells were treated with (A and C) Maplifa™ (12.5, 25, and 50 μg/mL) for 12 h or (B and D) GA (12.5, 25, and 50 μM) for 2 h. Then cells were incubated with DMEM containing DCFDA (20 μM) for 20 mins, followed by exposure of H2O2 or MGO (both at 400 μM) for 1 h or 24 h, respectively. ROS level was measured by cellular fluorescence intensity with excitation and emission wavelengths of 485 and 525 nm, respectively. (E) Representative fluorescent images of H2O2− and MGO-insulted HaCaT cells treated with Maplifa™ or GA. ##p < 0.01 and ###p < 0.001 as compared with control group; **p <0.01 as compared with model group.

