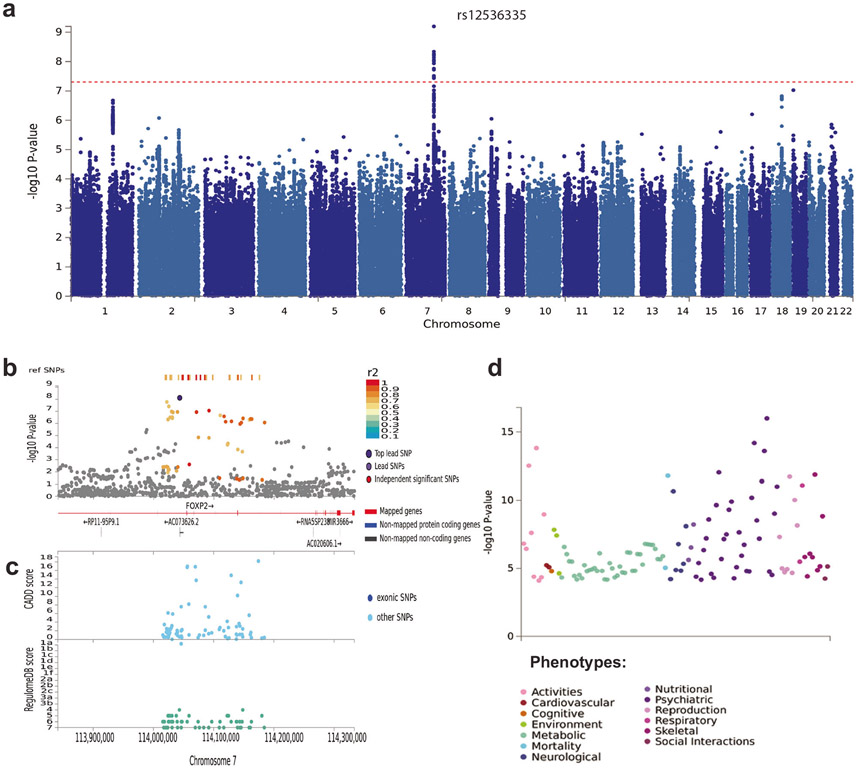
Fig. 1. SNP-based results from the GWAS meta-analysis (N = 85,359) on broad antisocial behavior.
a Manhattan plot of the GWAS meta-analysis, showing the negative log10-transformed p value for each SNP. SNP two-sided p values from a linear model were calculated using METAL [24], weighting SNP associations by sample size. b Regional association plot around chromosome 7:114043159 with functional annotations of SNPs in LD of lead SNP rs12536335 (shown in purple). The plot displays GWAS p value plotted against its chromosomal position, where colors represent linkage disequilibrium and r2 values with the most significantly associated SNP. c The plot displays CADD scores (Combined Annotation Dependent Depletion) and RegulomeDB scores of these SNPs. d PheWAS plot showing the significance of associations of common variation in the FOXP2 gene with a wide range of traits and diagnoses based on MAGMA gene-based tests (with Bonferroni-corrected p value: 1.05e–5), as obtained from GWASAtlas (https://atlas.ctglab.nl).

