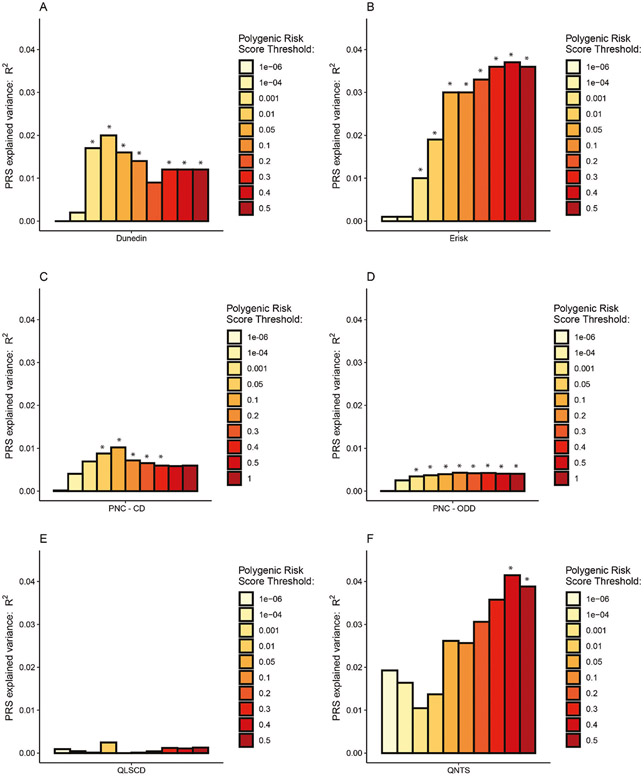
Fig. 2. Bar charts illustrating the proportion of variance (incremental R2, or ΔR2) explained by the PRSs.
PRSs are shown for broad ASB associated with childhood ASB in the Dunedin Longitudinal Study (A), with externalizing behavior in the E-Risk Study (B), with Conduct Disorder (C) and Oppositional Defiant Disorder (D) in the Philadelphia Neurodevelopmental Cohort Study, with ASB in the Quebec Longitudinal Study of Children’s Development Study (E), and with time-aggregated ASB in the Quebec Newborn Twin Study (F). Asterisks (*) show statistical significance after applying a Bonferroni correction on the 22 tested phenotypes at p < 0.0023.

