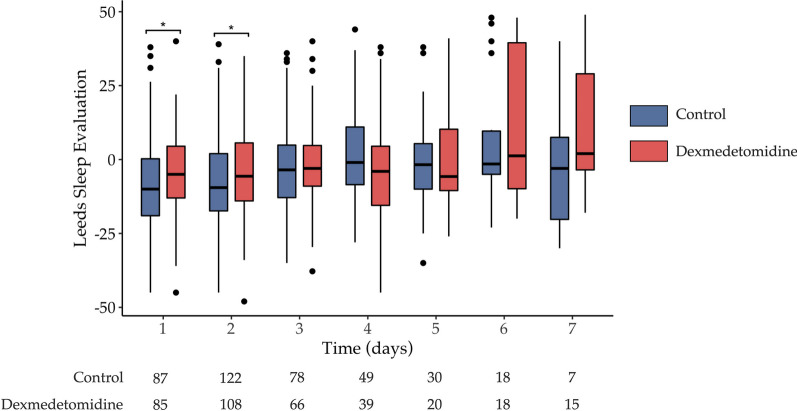
Fig. 2.
Daily evaluation of sleep quality by the LSEQ (Leeds Sleep Evaluation Questionnaire) in as-treated population. The horizontal lines in the centre of each boxes indicates the median; lower and upper hinges correspond respectively to the first and third quartiles (the 25th and 75th percentiles); upper whisker extends from the hinge to the largest value no further than 1.5 times IQR from the hinge (where IQR is the inter-quartile range, or distance between the first and third quartiles); lower whisker extends from the hinge to the smallest value at most 1.5 times IQR of the hinge. Data beyond the end of the whiskers represents outliers and are plotted individually. *: p < 0.05, results are expressed with box and whiskers

